I present to you a brand new indicator.
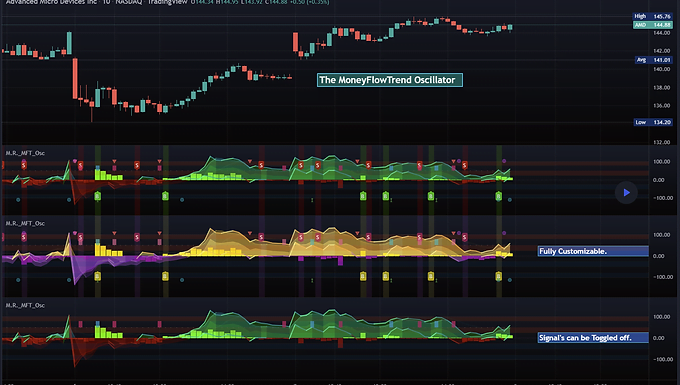
I call it the MoneyFlowTrend Oscillator. This is another one that I’ve been piecing together for years and learning how to code pine has allowed me to bring it to life.
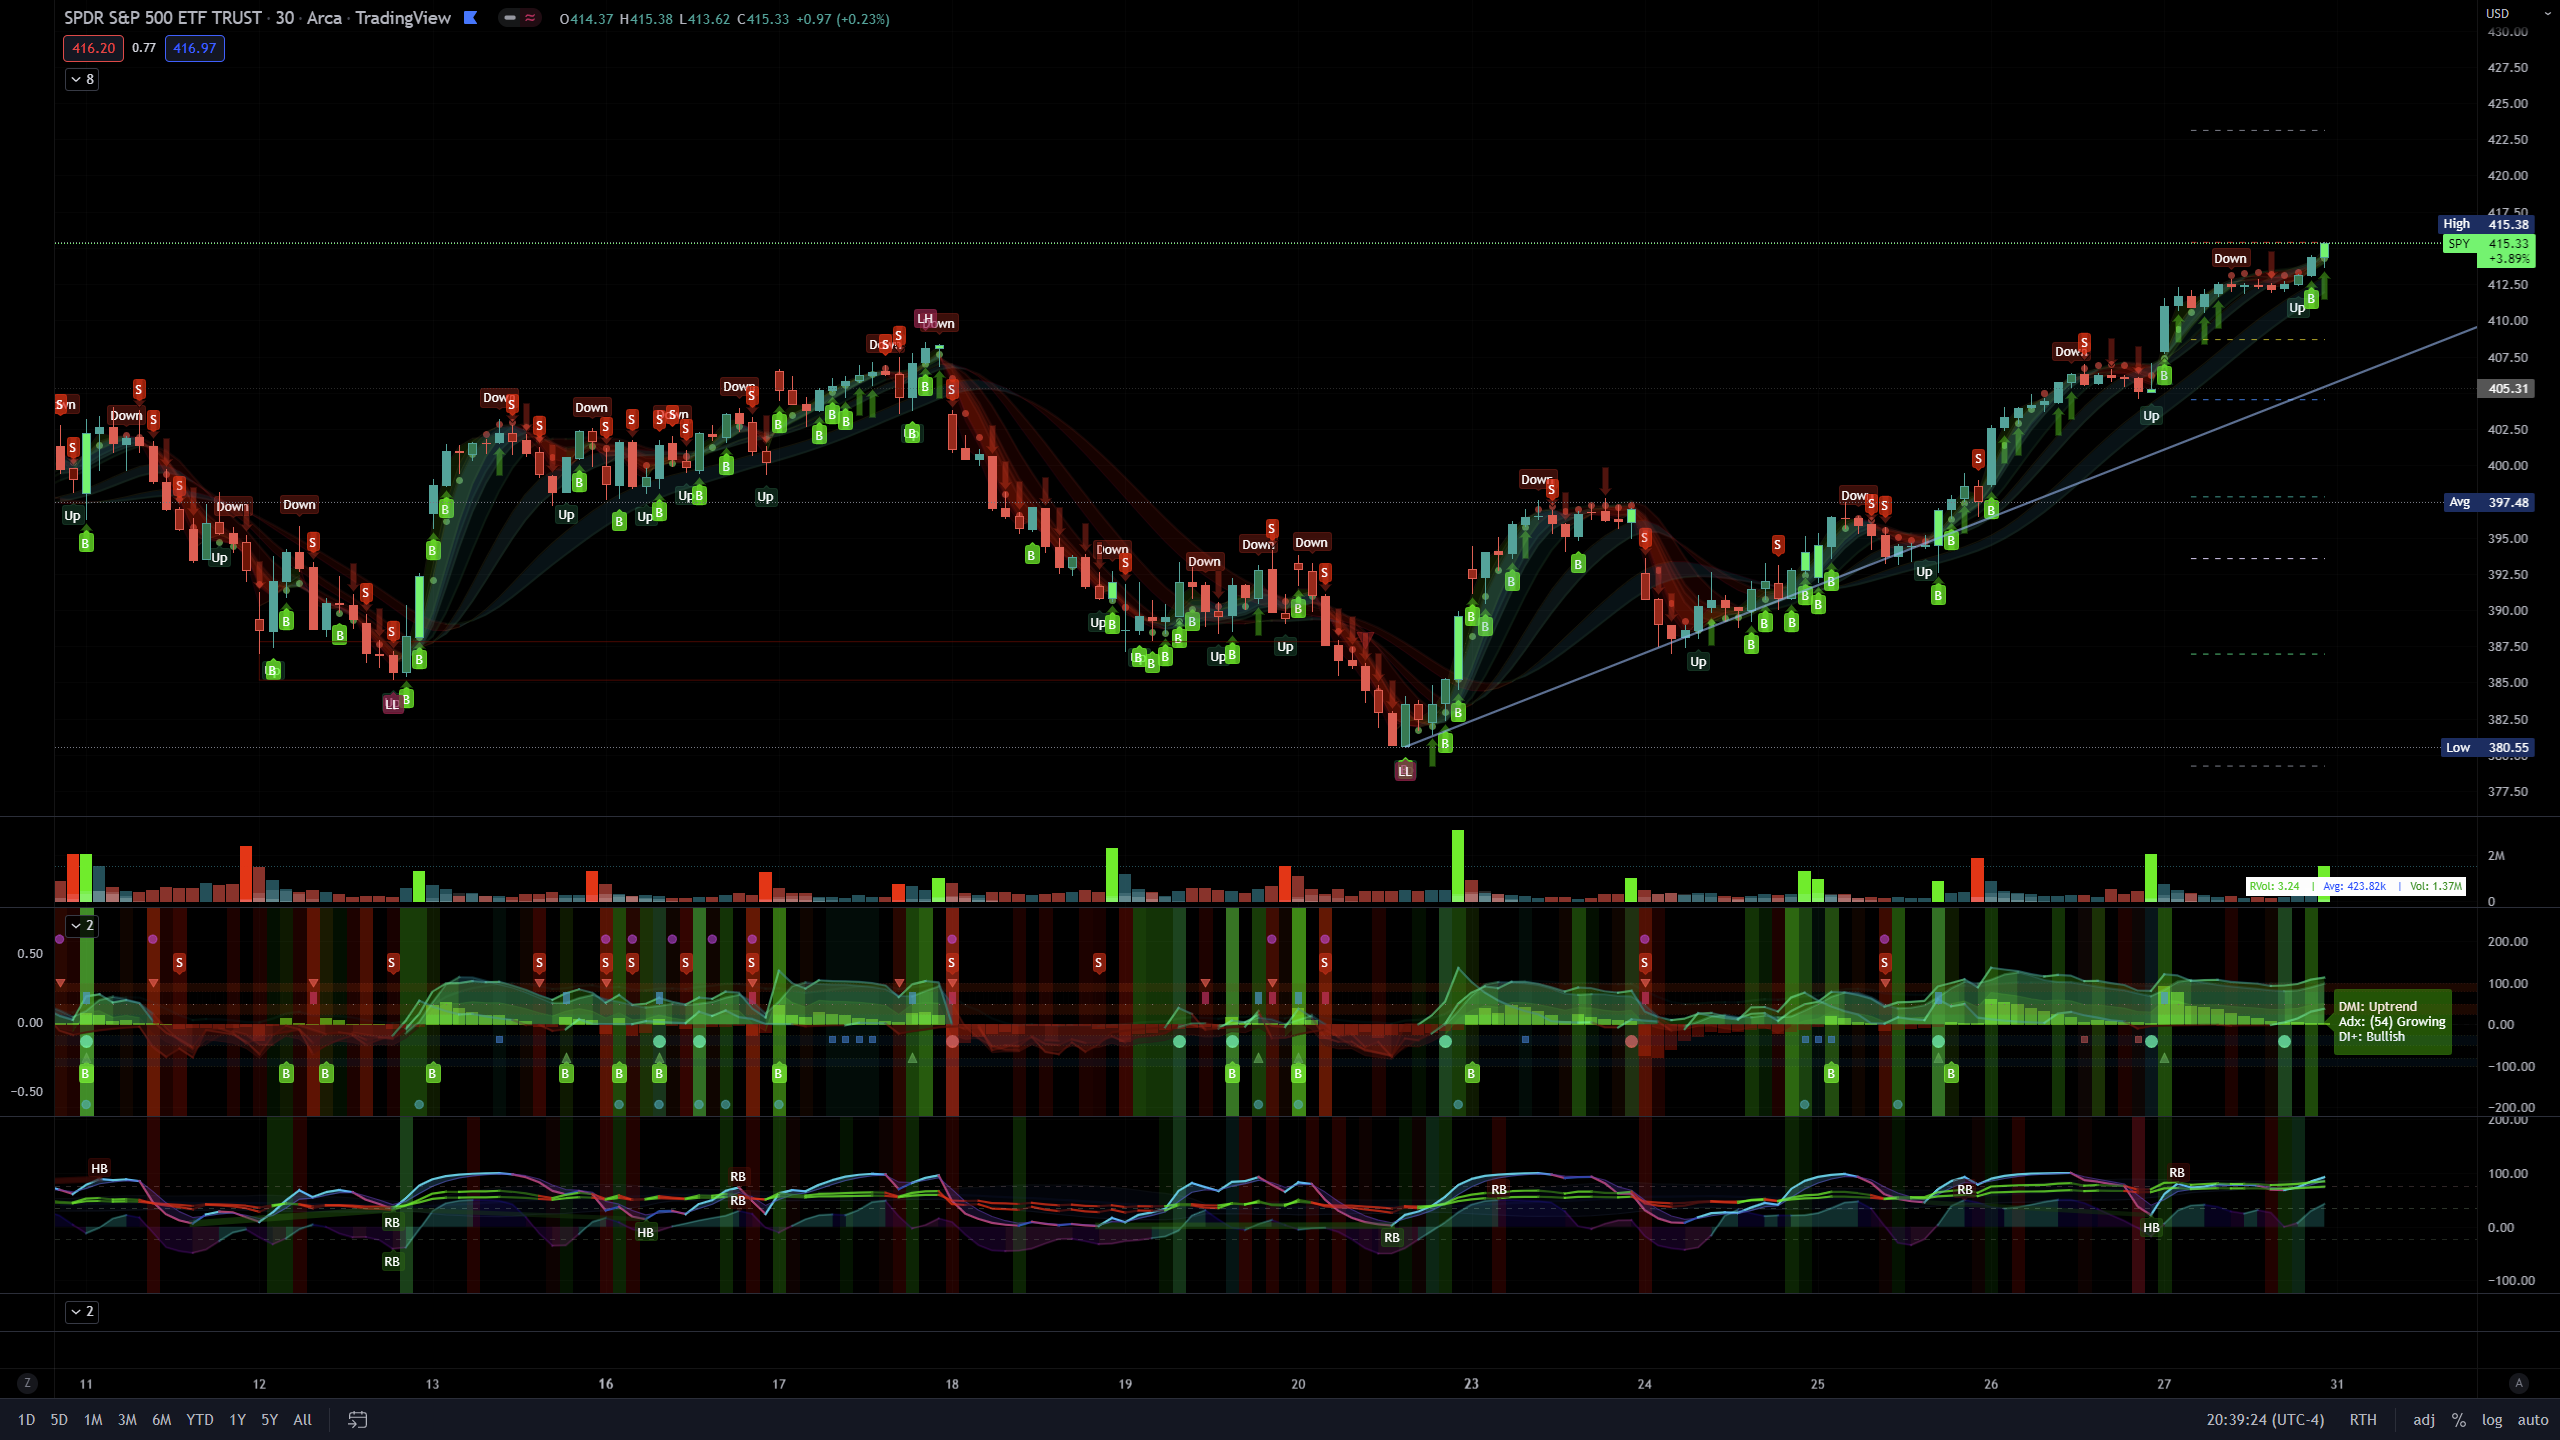
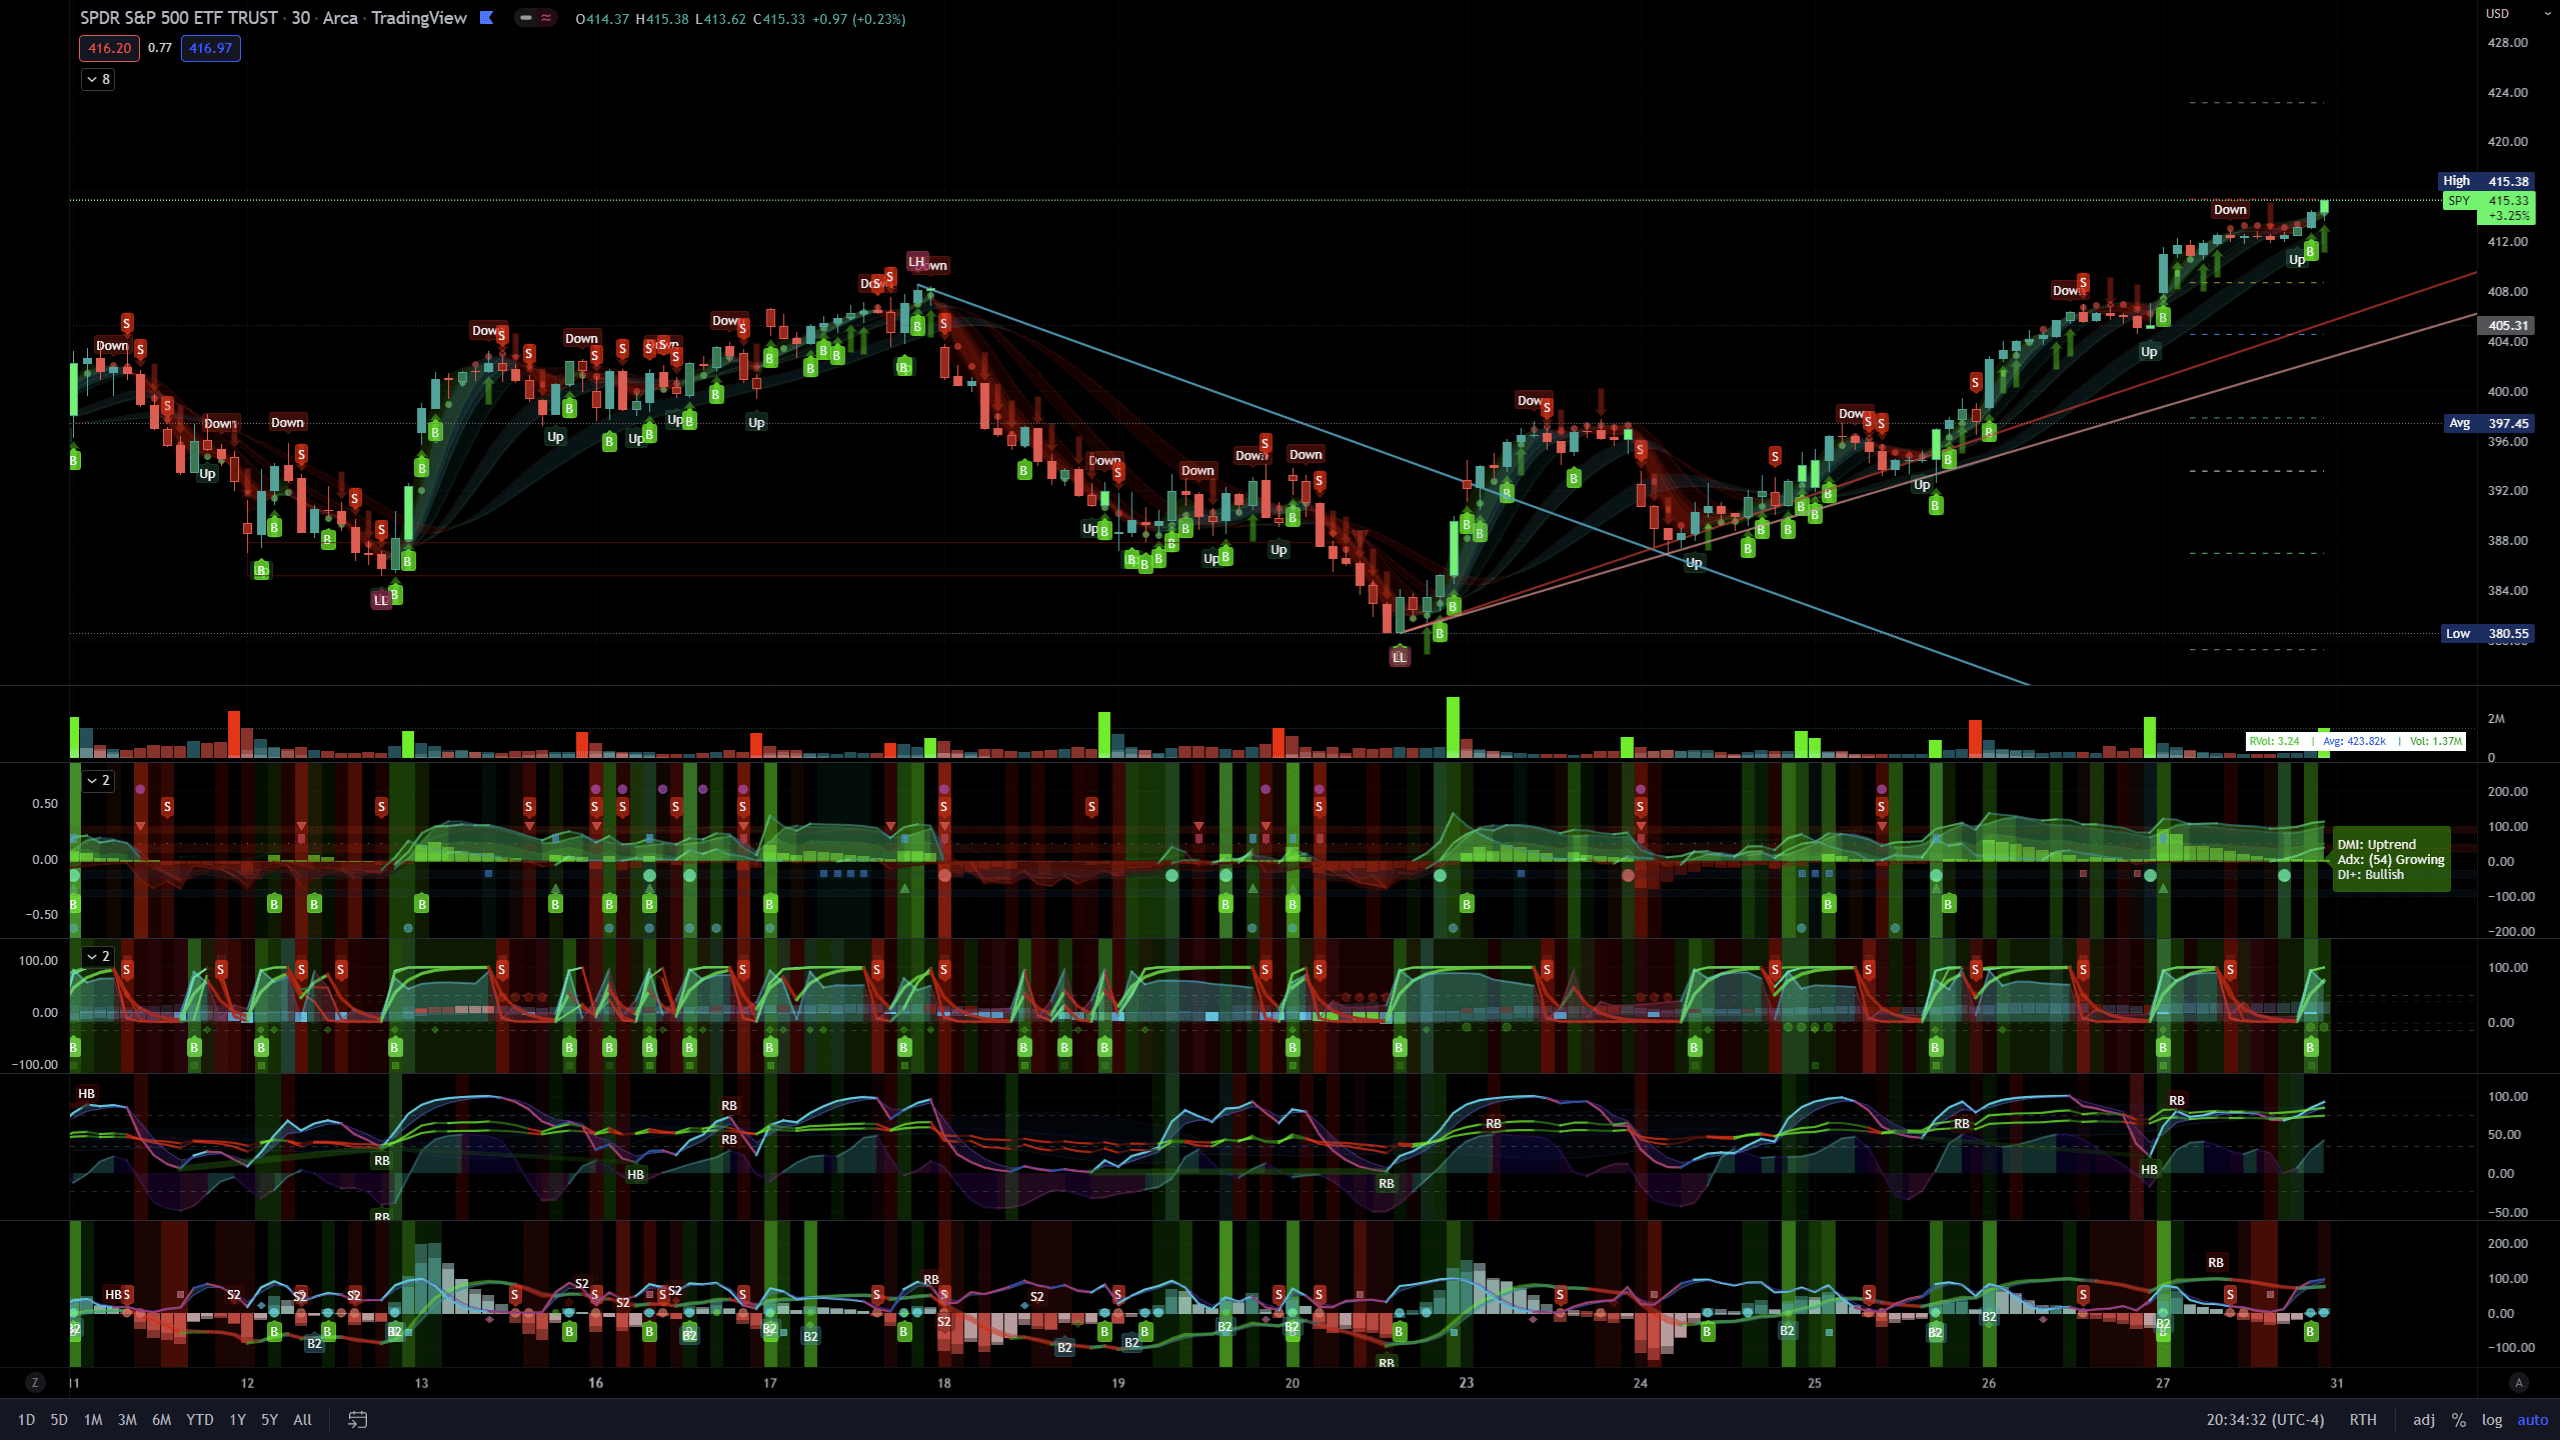
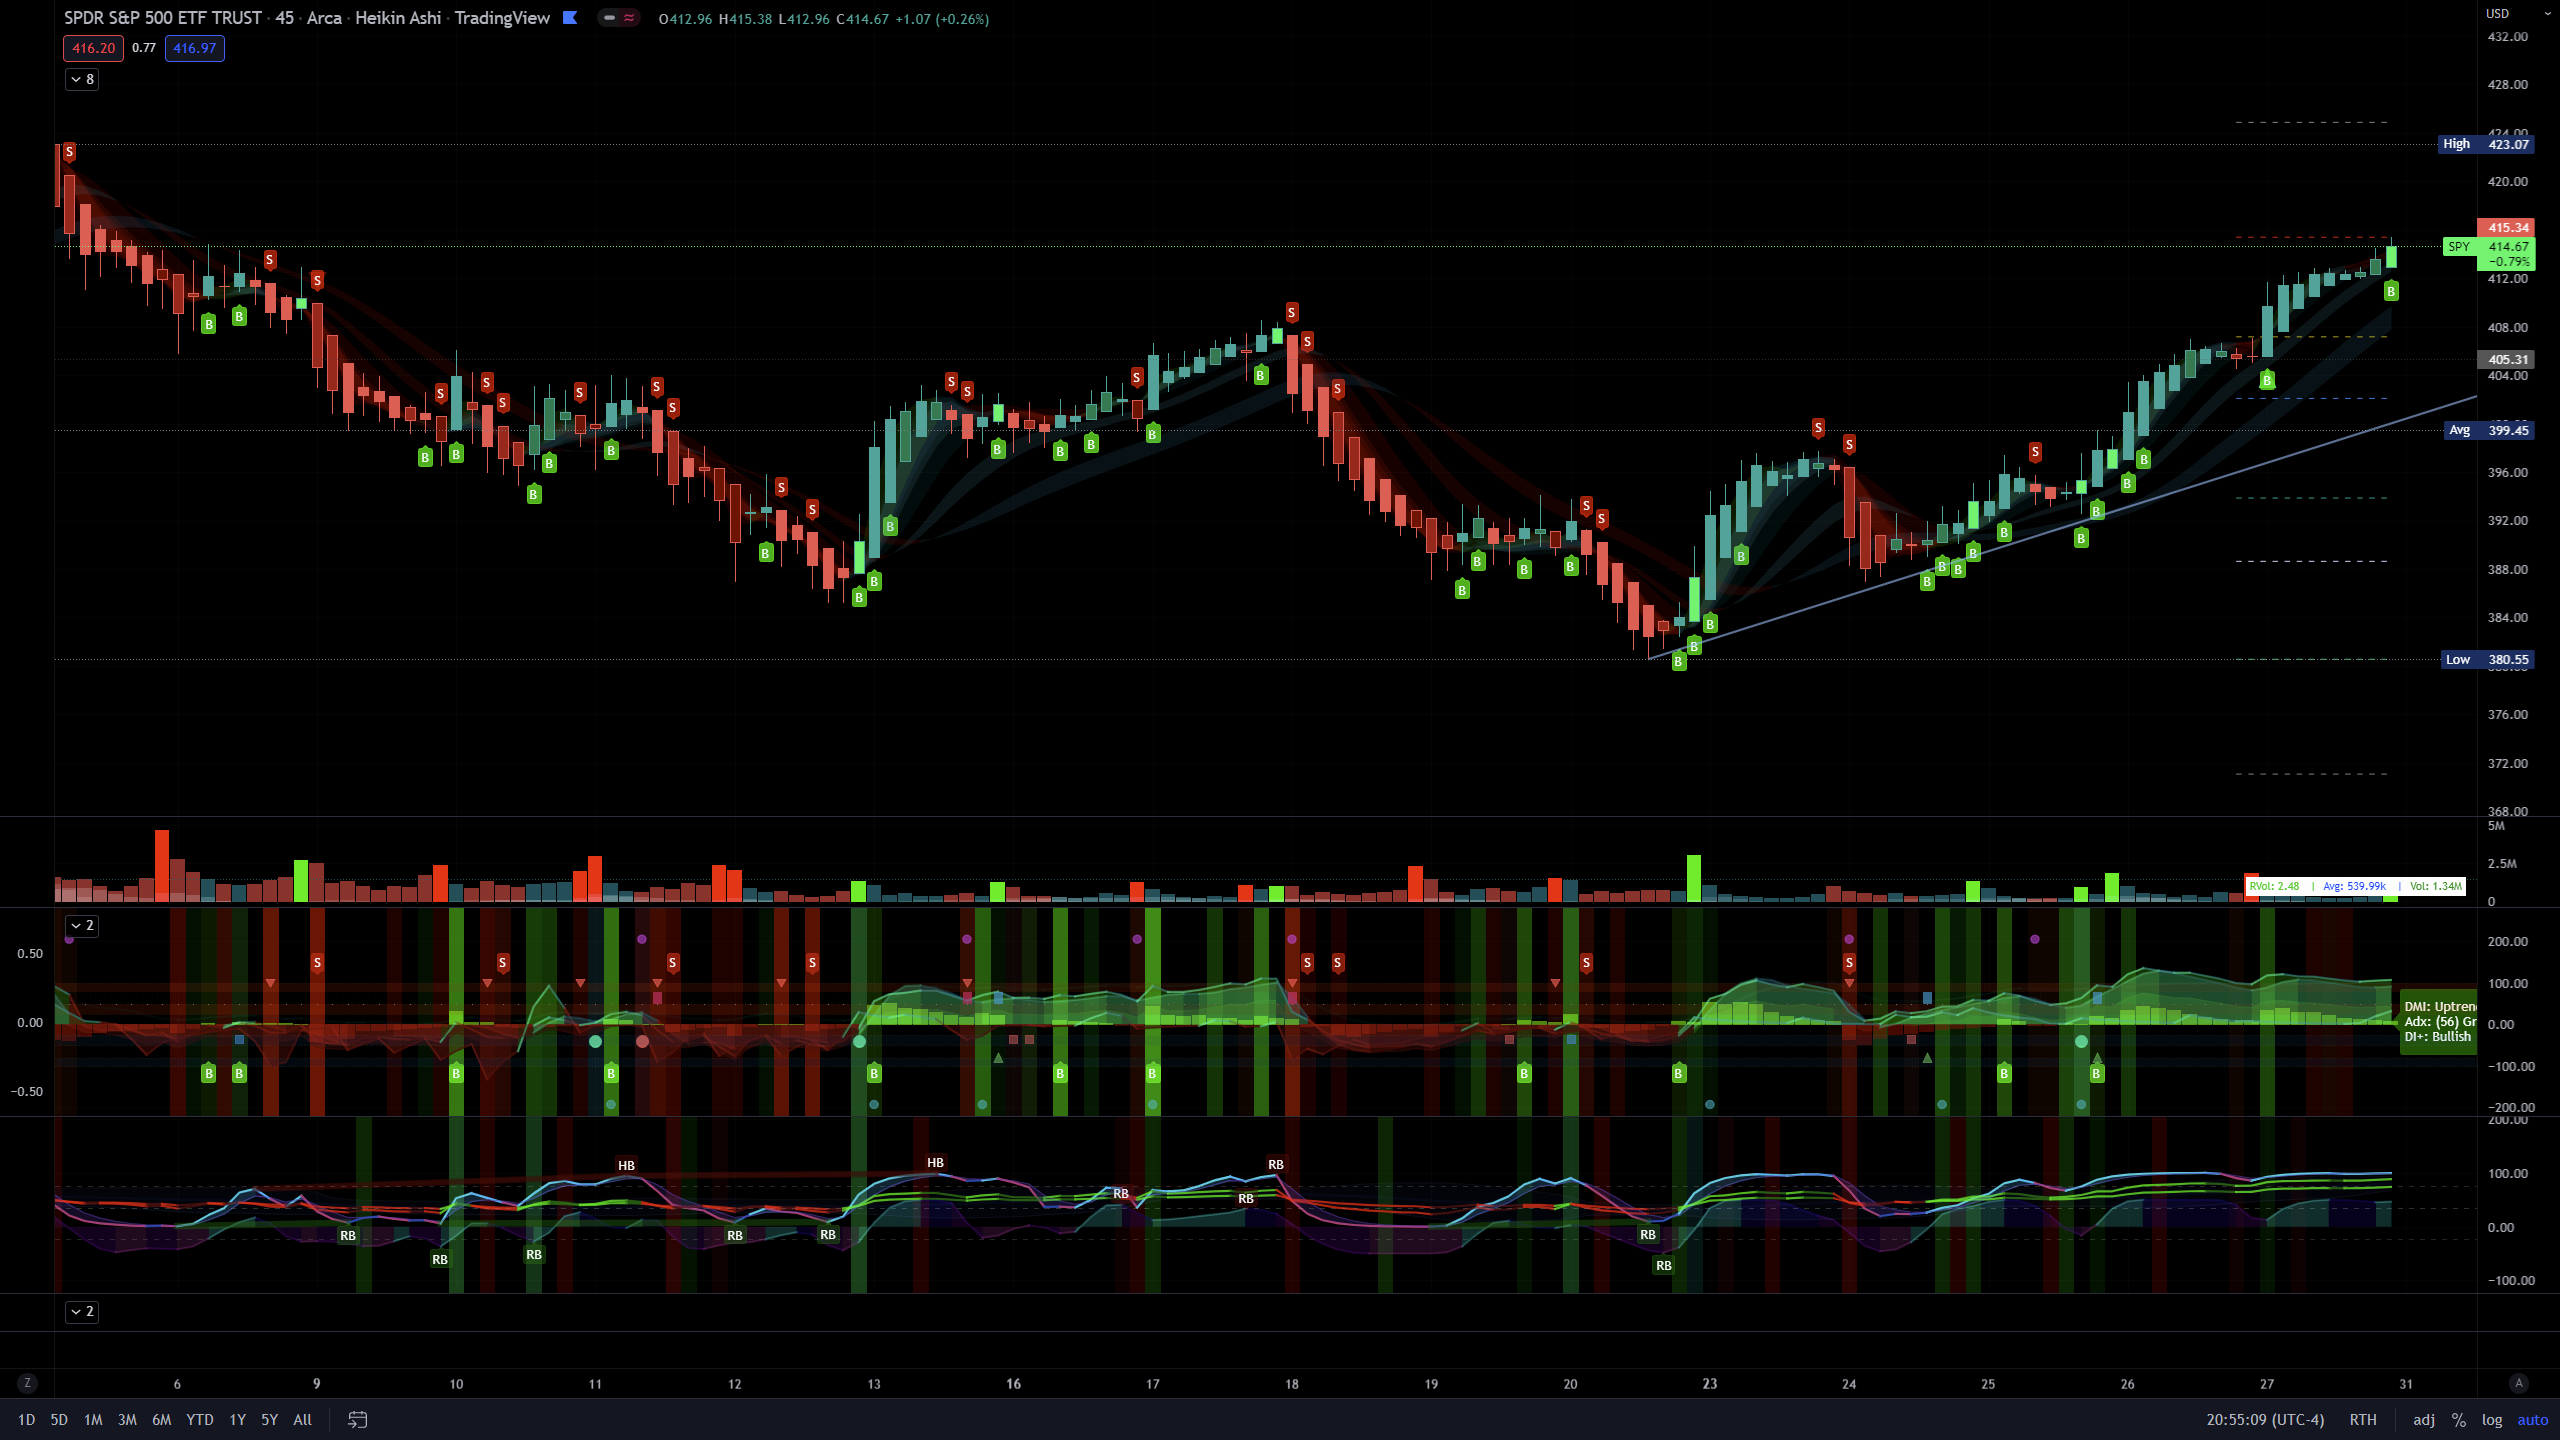
Built on the idea of Supply & Demand Zones, this utilizes money flow and numerous calculations to create a picture of what is happening underneath the surface of the price action.
Richard Wykoff was one of the first market analysts to explain how the economic cycle can be applied to explain market price action; thus, technical analysis . He described two zones among the total of 4 phases; the two zones are Distribution and Accumulation zones, also known as Supply & Demand zones.
Since most of you already know the economic cycle , I will try to be concise.
The basic ideas:
- When supply is greater than demand, the price goes up down.
- When demand is greater than supply, price goes up.
- When demand is equal to supply, the price stays about the same (going sideways).
Price action has –Uptrends, downtrends, and price ranges (consolidation).
Wykoff’s 4 phases to explain this price action :
- Accumulation (Demand zone)
- Markup (Uptrend)
- Distribution (Supply zone)<
- Markdown (Downtrend)
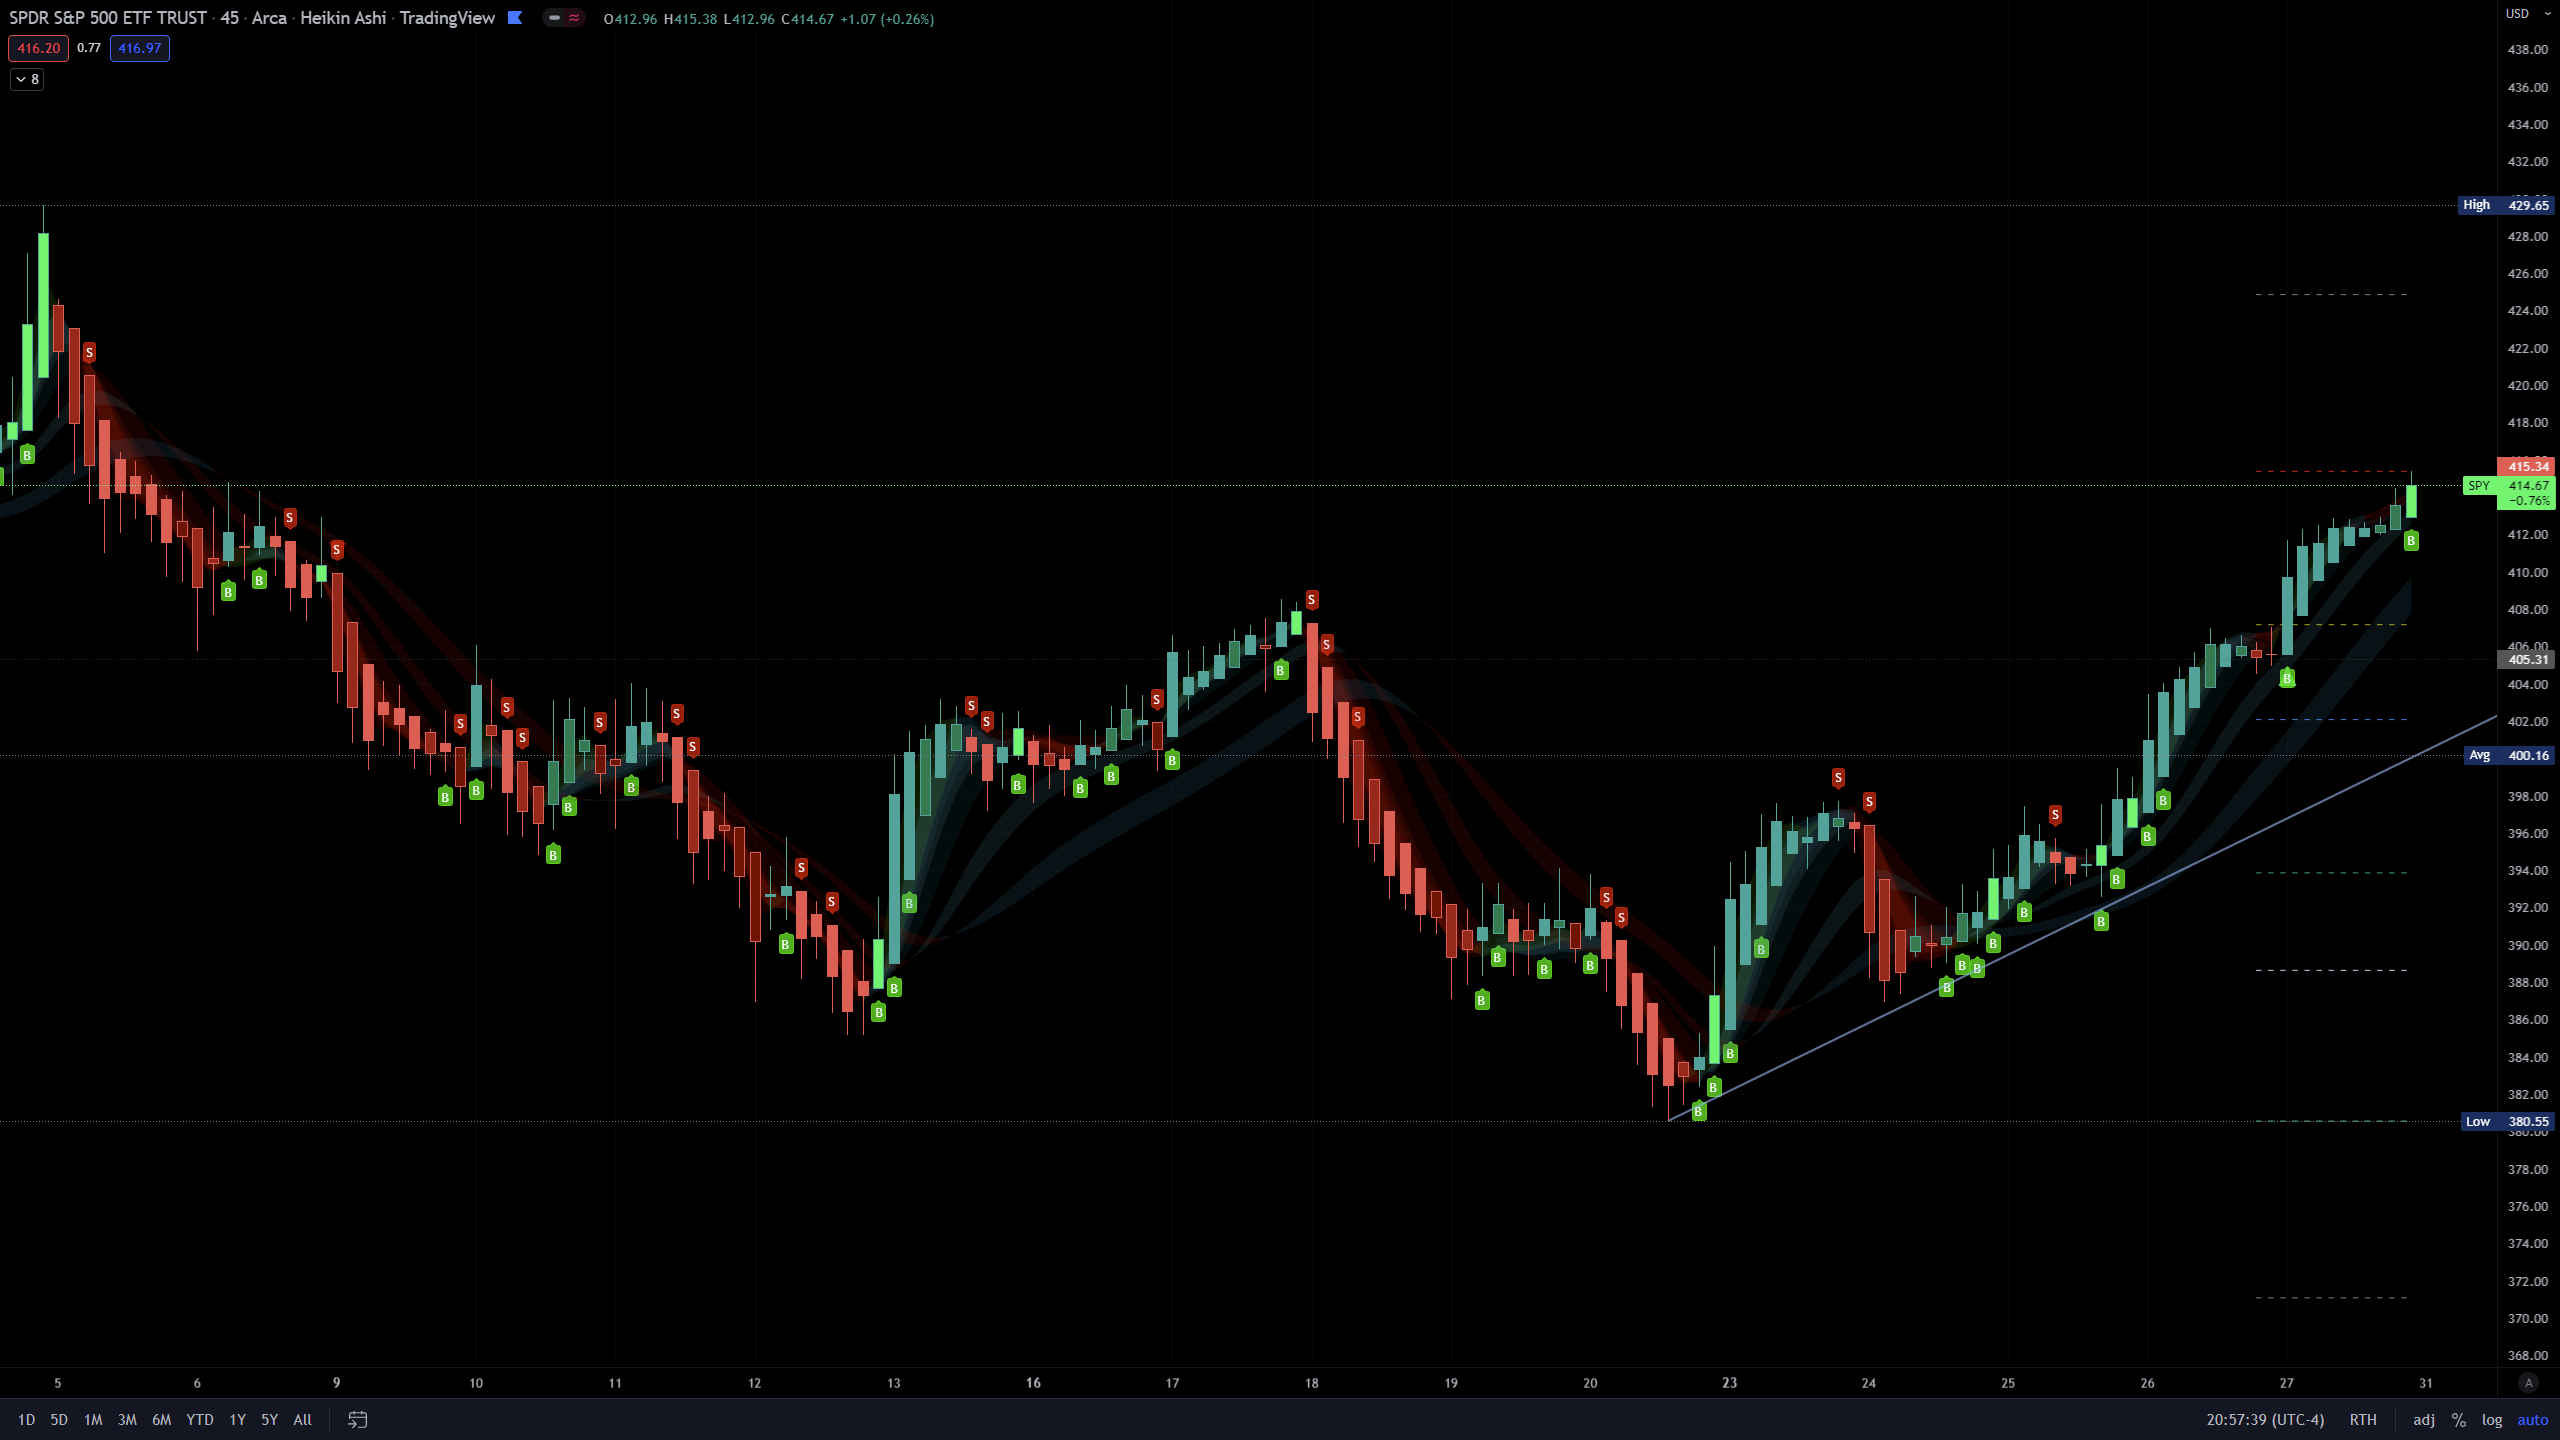
With all that said, usually you will either see a sharp jump from a supply or demand zone or it will consolidate within it. Until a new one is formed on the chart.
This indicator attempts to put all of that into a lower indicator. I tried to separate the retailers and the banks and then put them back together to get a full picture.