Description
- For a limited time, Auto-Trendlines Pro and Awesome RSI Bundle!
- Enjoy two of the Best Tradingview Indicators – each with EXTENSIVE lists of features.
- Supports Improvement of Current and Future Content.
- Save over 50%!
Auto-Trendlines Pro — Full-featured auto-trendline support and resistance indicator.
This makes it easier for beginners and professionals alike to analyze charts for trending support and resistance. Almost magically provides traders with REAL-TIME Trendline Support & Resistance.
What are Trendlines and why do we use them?
In short, a trendline is a diagonal line that connects to two or more price points on a chart to show the current direction of price. These are used to identify and confirm trend direction in technical analysis and show support and resistance points.
Using pivot points and different calculations for sources, we’re able to create the trendlines; with adjustable slopes (or just use of proprietary calculations) we can force these trendlines to line up with the current trend or let them automatically.
- Accurate auto-drawn calculated trendlines .
- Fully customizable – the ability to adjust the trendlines easily to exact specifications with every type of trader in mind.
- Can be used to spot long trend as well as short, by adjusting length or using extend both to see previous pivots it’s touched.
- Can show old trendlines for pattern analysis.
- Auto-labels Higher-Highs (HH), Higher-Lows, Lower-Highs, Lower-Lows at pivots.
- Lining up trendlines with Break signals can help provide more accurate trendlines (potentially teaching) beginners how to draw them better.
- UPRIGHT’s Signature double trendline set.
- Buy/Sell Labels after trendline resistance breaks
- Adjust the opacity to hide or fade a line (as seen above).
- Pre-filled alerts for those breakouts / breakdowns.
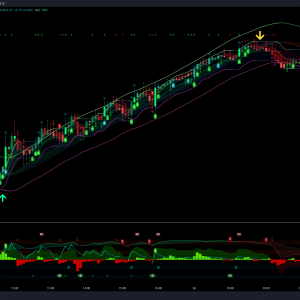
Awesome RSI+ — An RSI more accurate and able than most Algo trading systems. The cleanest, most accurate, full featured, easy-to-use RSI out there.
This indicator will act similarly to a regular RSI (Relative Strength Indicator) in that there are Oversold and Overbought levels, but also volatility bands around it to allow for more accurate signals whilst moving the Oversold (OS) and Overbought (OB) levels further apart (less false OB/OS signals). As shown in the chart above, it’s able to detect some pretty big moves with both speed and accuracy.
Most of you are familiar with and use an RSI indicator so I will keep this description as brief as possible: The Relative Strength Index (RSI), developed by the legendary J. Welles Wilder Jr., is a momentum oscillator that measures the speed and change of price movements; it oscillates between 0 – 100, with levels set as Overbought and Oversold. These levels are where a trader make look for a reversal. However, they must keep in mind in an uptrend or bull market, the RSI remains in the 40 – 90 range; 40 – 50 zone often will act as support. More advanced traders will also look for divergences between the price and the oscillator (i.e. price trending upward while oscillator trending downward). As far as oscillators go, the RSI is one of the most frequently used, by both advanced and beginner traders alike.
Works great on multiple timeframes. It may not catch every rally, but it will catch most —even on smaller timeframes (i.e. 5 minutes in image below).
Features:
- Insanely accurate signals on almost every bar.
- UPRIGHT’s Ultra Smooth RSI for Ultra Fast confirmation.
- Stochastic RSI added for additional dimension.
- Stochastic RSI Divergences (Regular and Hidden w/Lines)
- Ultra RSI Regular Divergences (additional confirmation and early trend change detection).
- Extremely accurate background highlight buy & sell signals to be used with the above mentioned.
- UPRIGHT’s Double RSI Ribbon provides both OB/OS detection and trend guidance.
- Fully customizable