(This is an original creation and a proof of concept.)
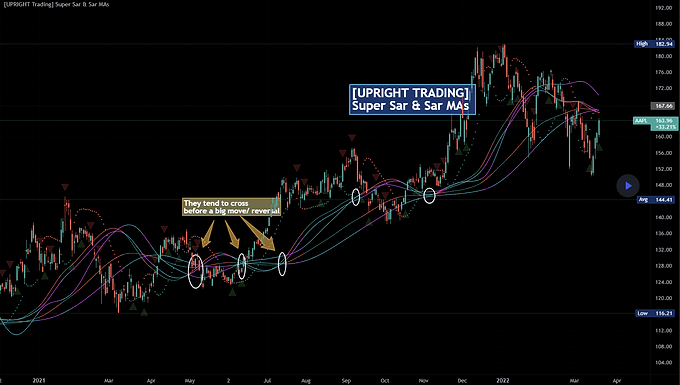
As most of you know the PSAR, parabolic SAR indicator, was developed by J. Welles Wilder Jr. and used to determine trend direction and potential reversals in price. This technical indicator uses a trailing stop and reverse method, ‘SAR,’ or “stop and reverse,” to find potential exit and entry points.
My question was: Is it possible to create meaningful Moving Averages by using PSAR? Turns out, the answer is yes.
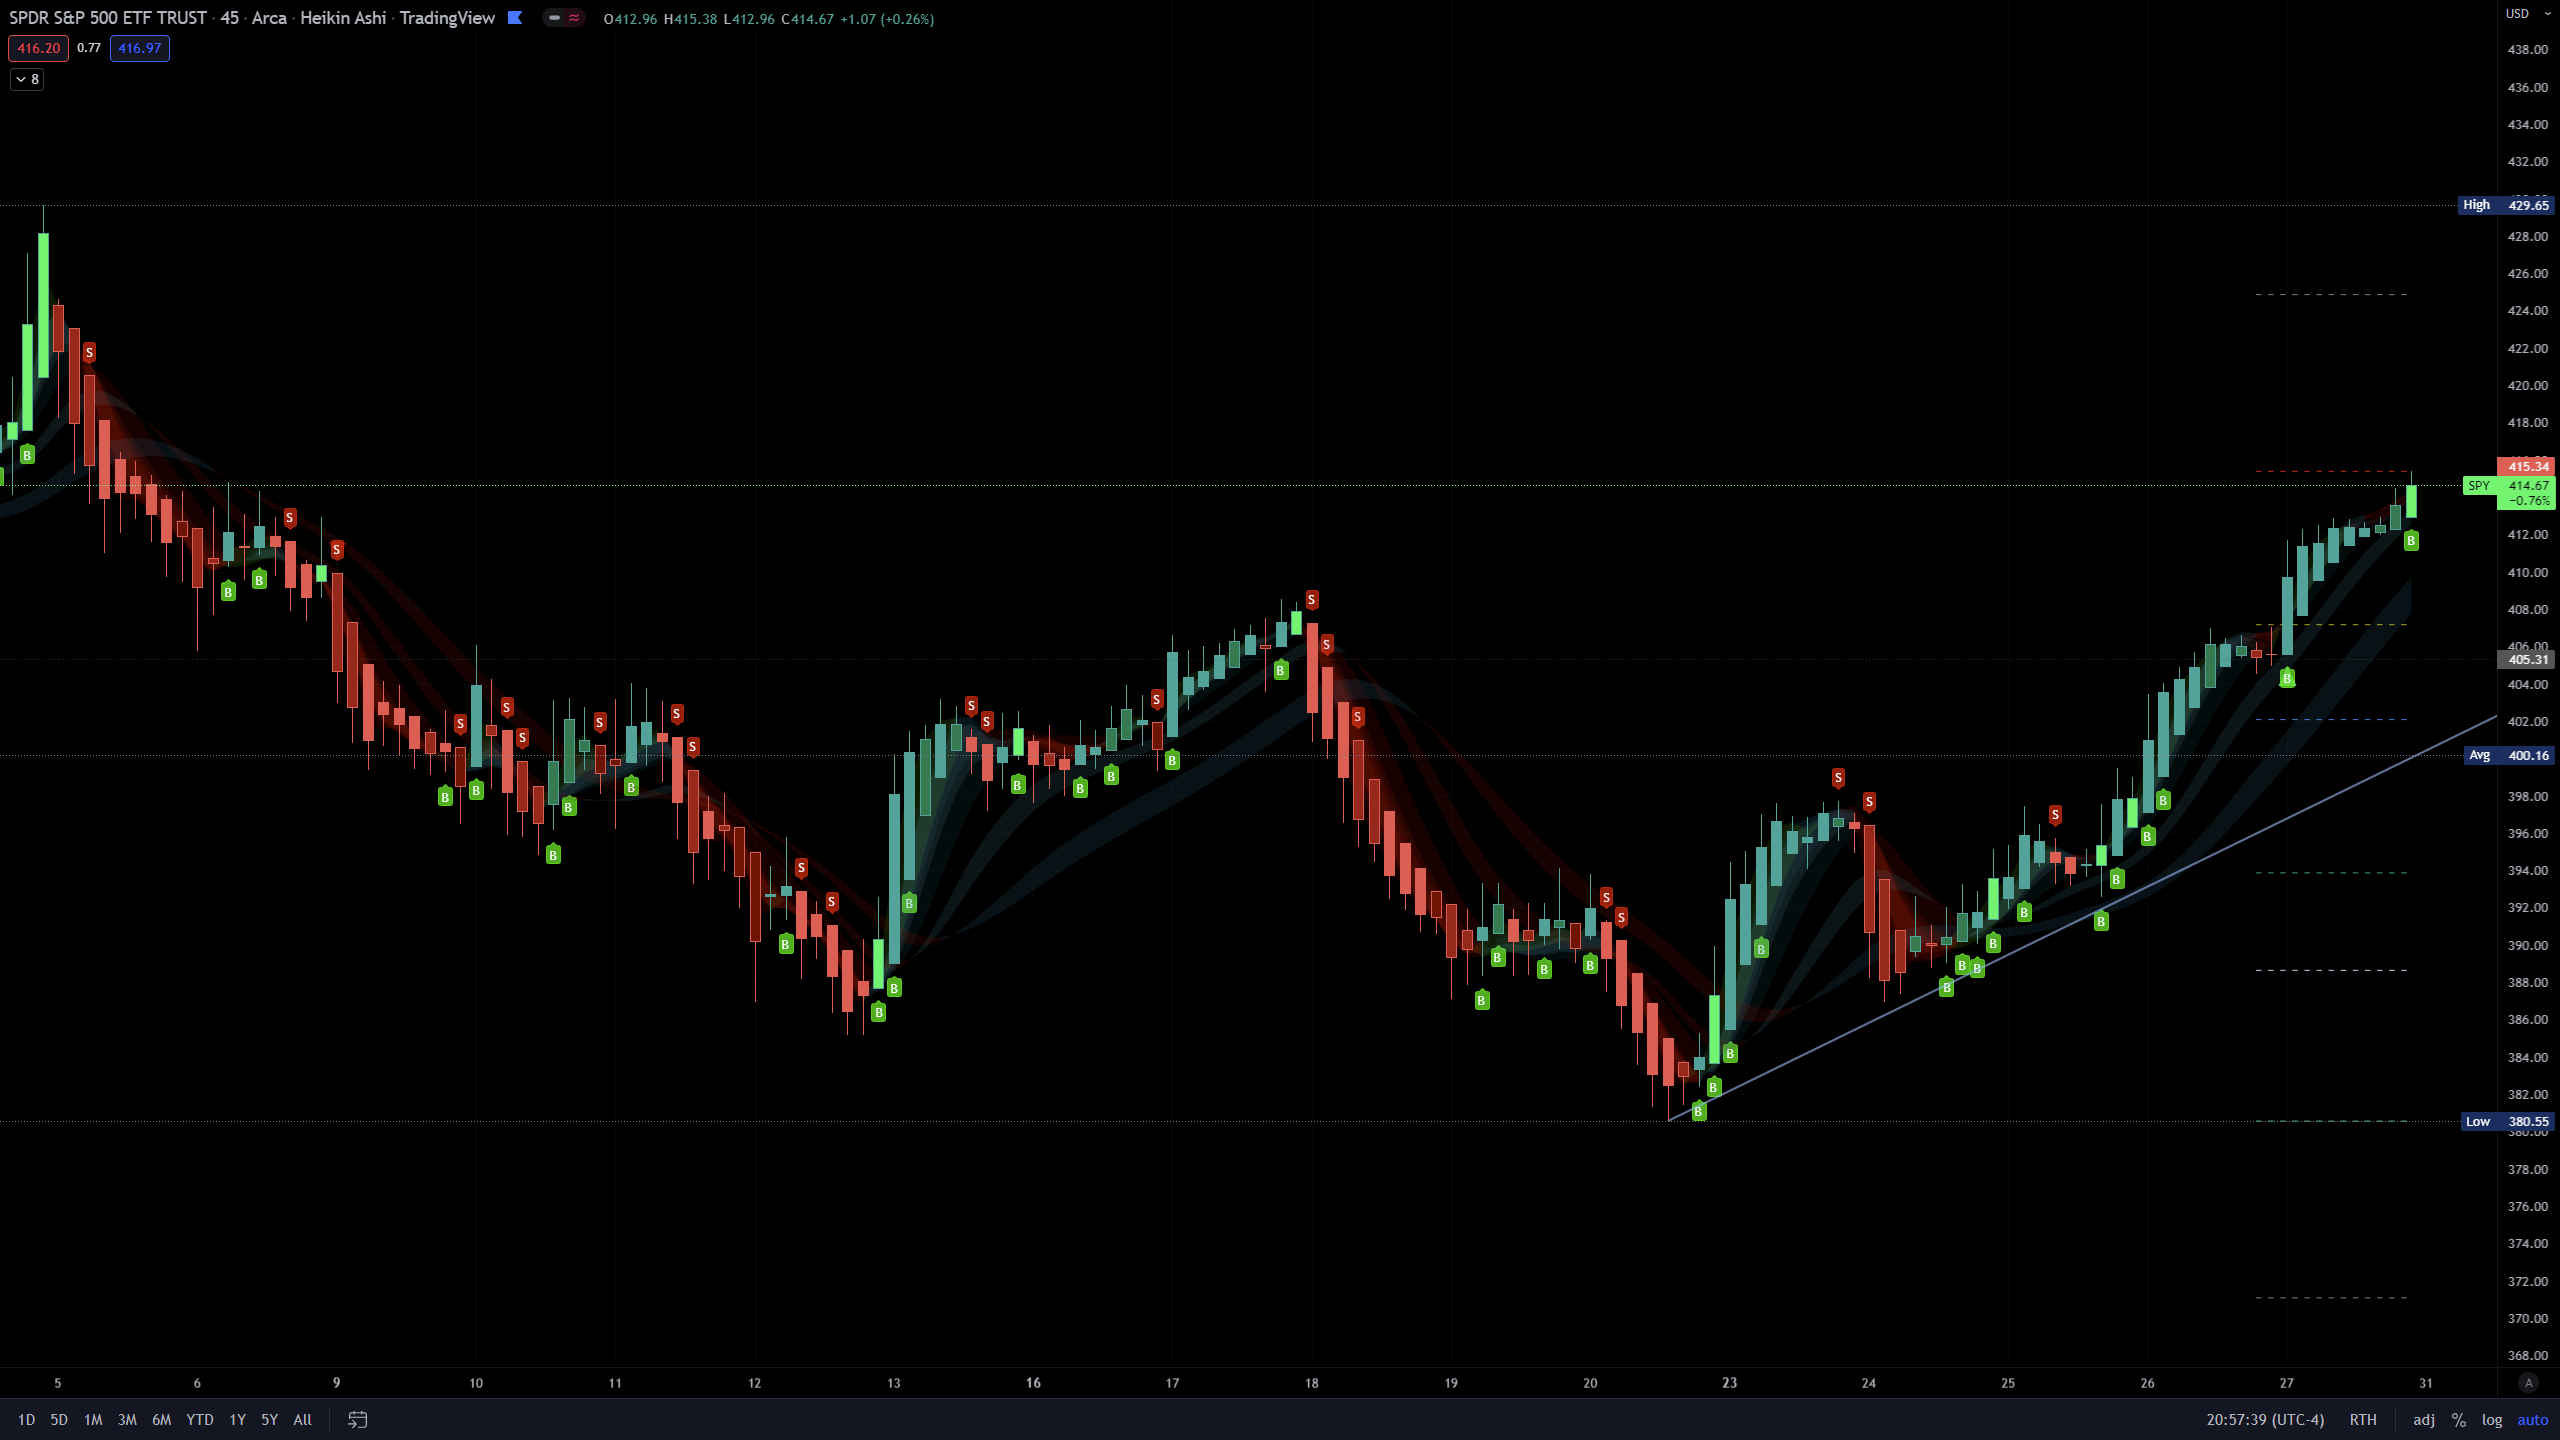
As you can see on the above chart, not only is it possible, it does work.
Features:
I’ve created buy/sell signals, which act as early indication of a potential reversal.
5 original MAs.
My Super Sar
Customizability: For now, the ability to adjust the length and turn on/off the MAs (maybe more features to come).