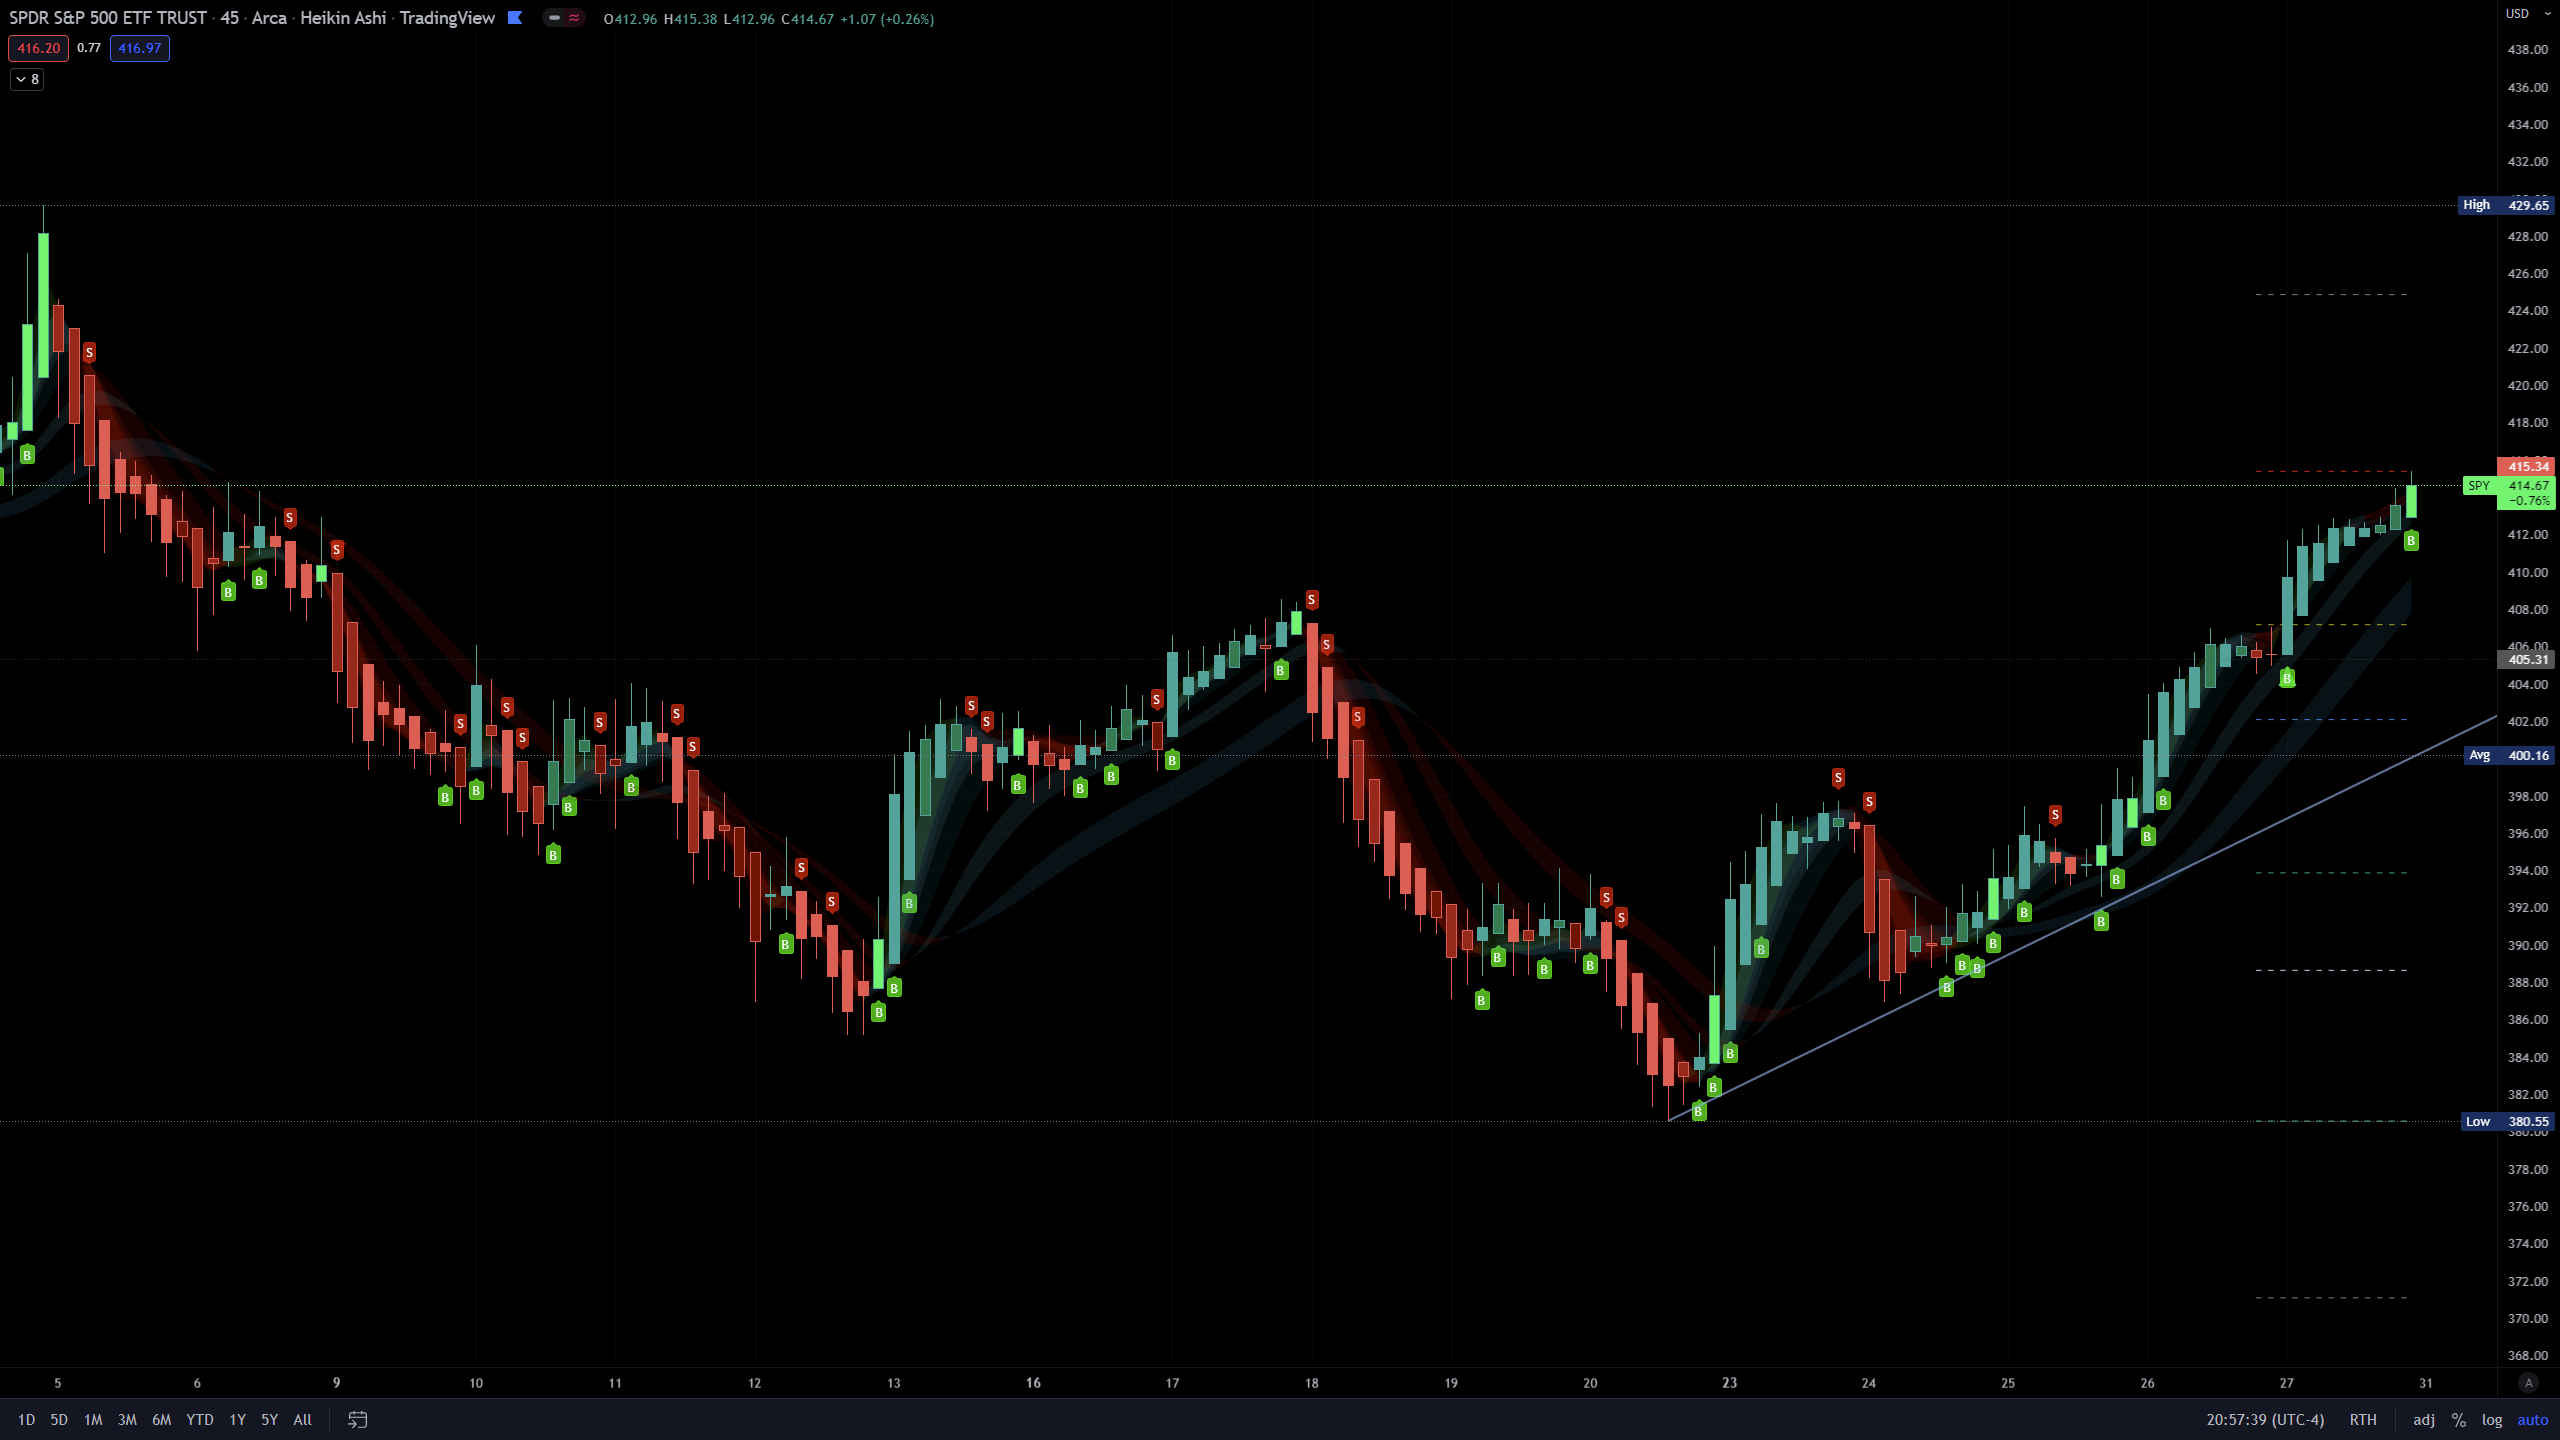
Uses volatility and standard deviations to show you the top and bottom of trends.
It does indeed work on lower timeframes, I typically use it on 5m, 30m, 4hr, and 1d.
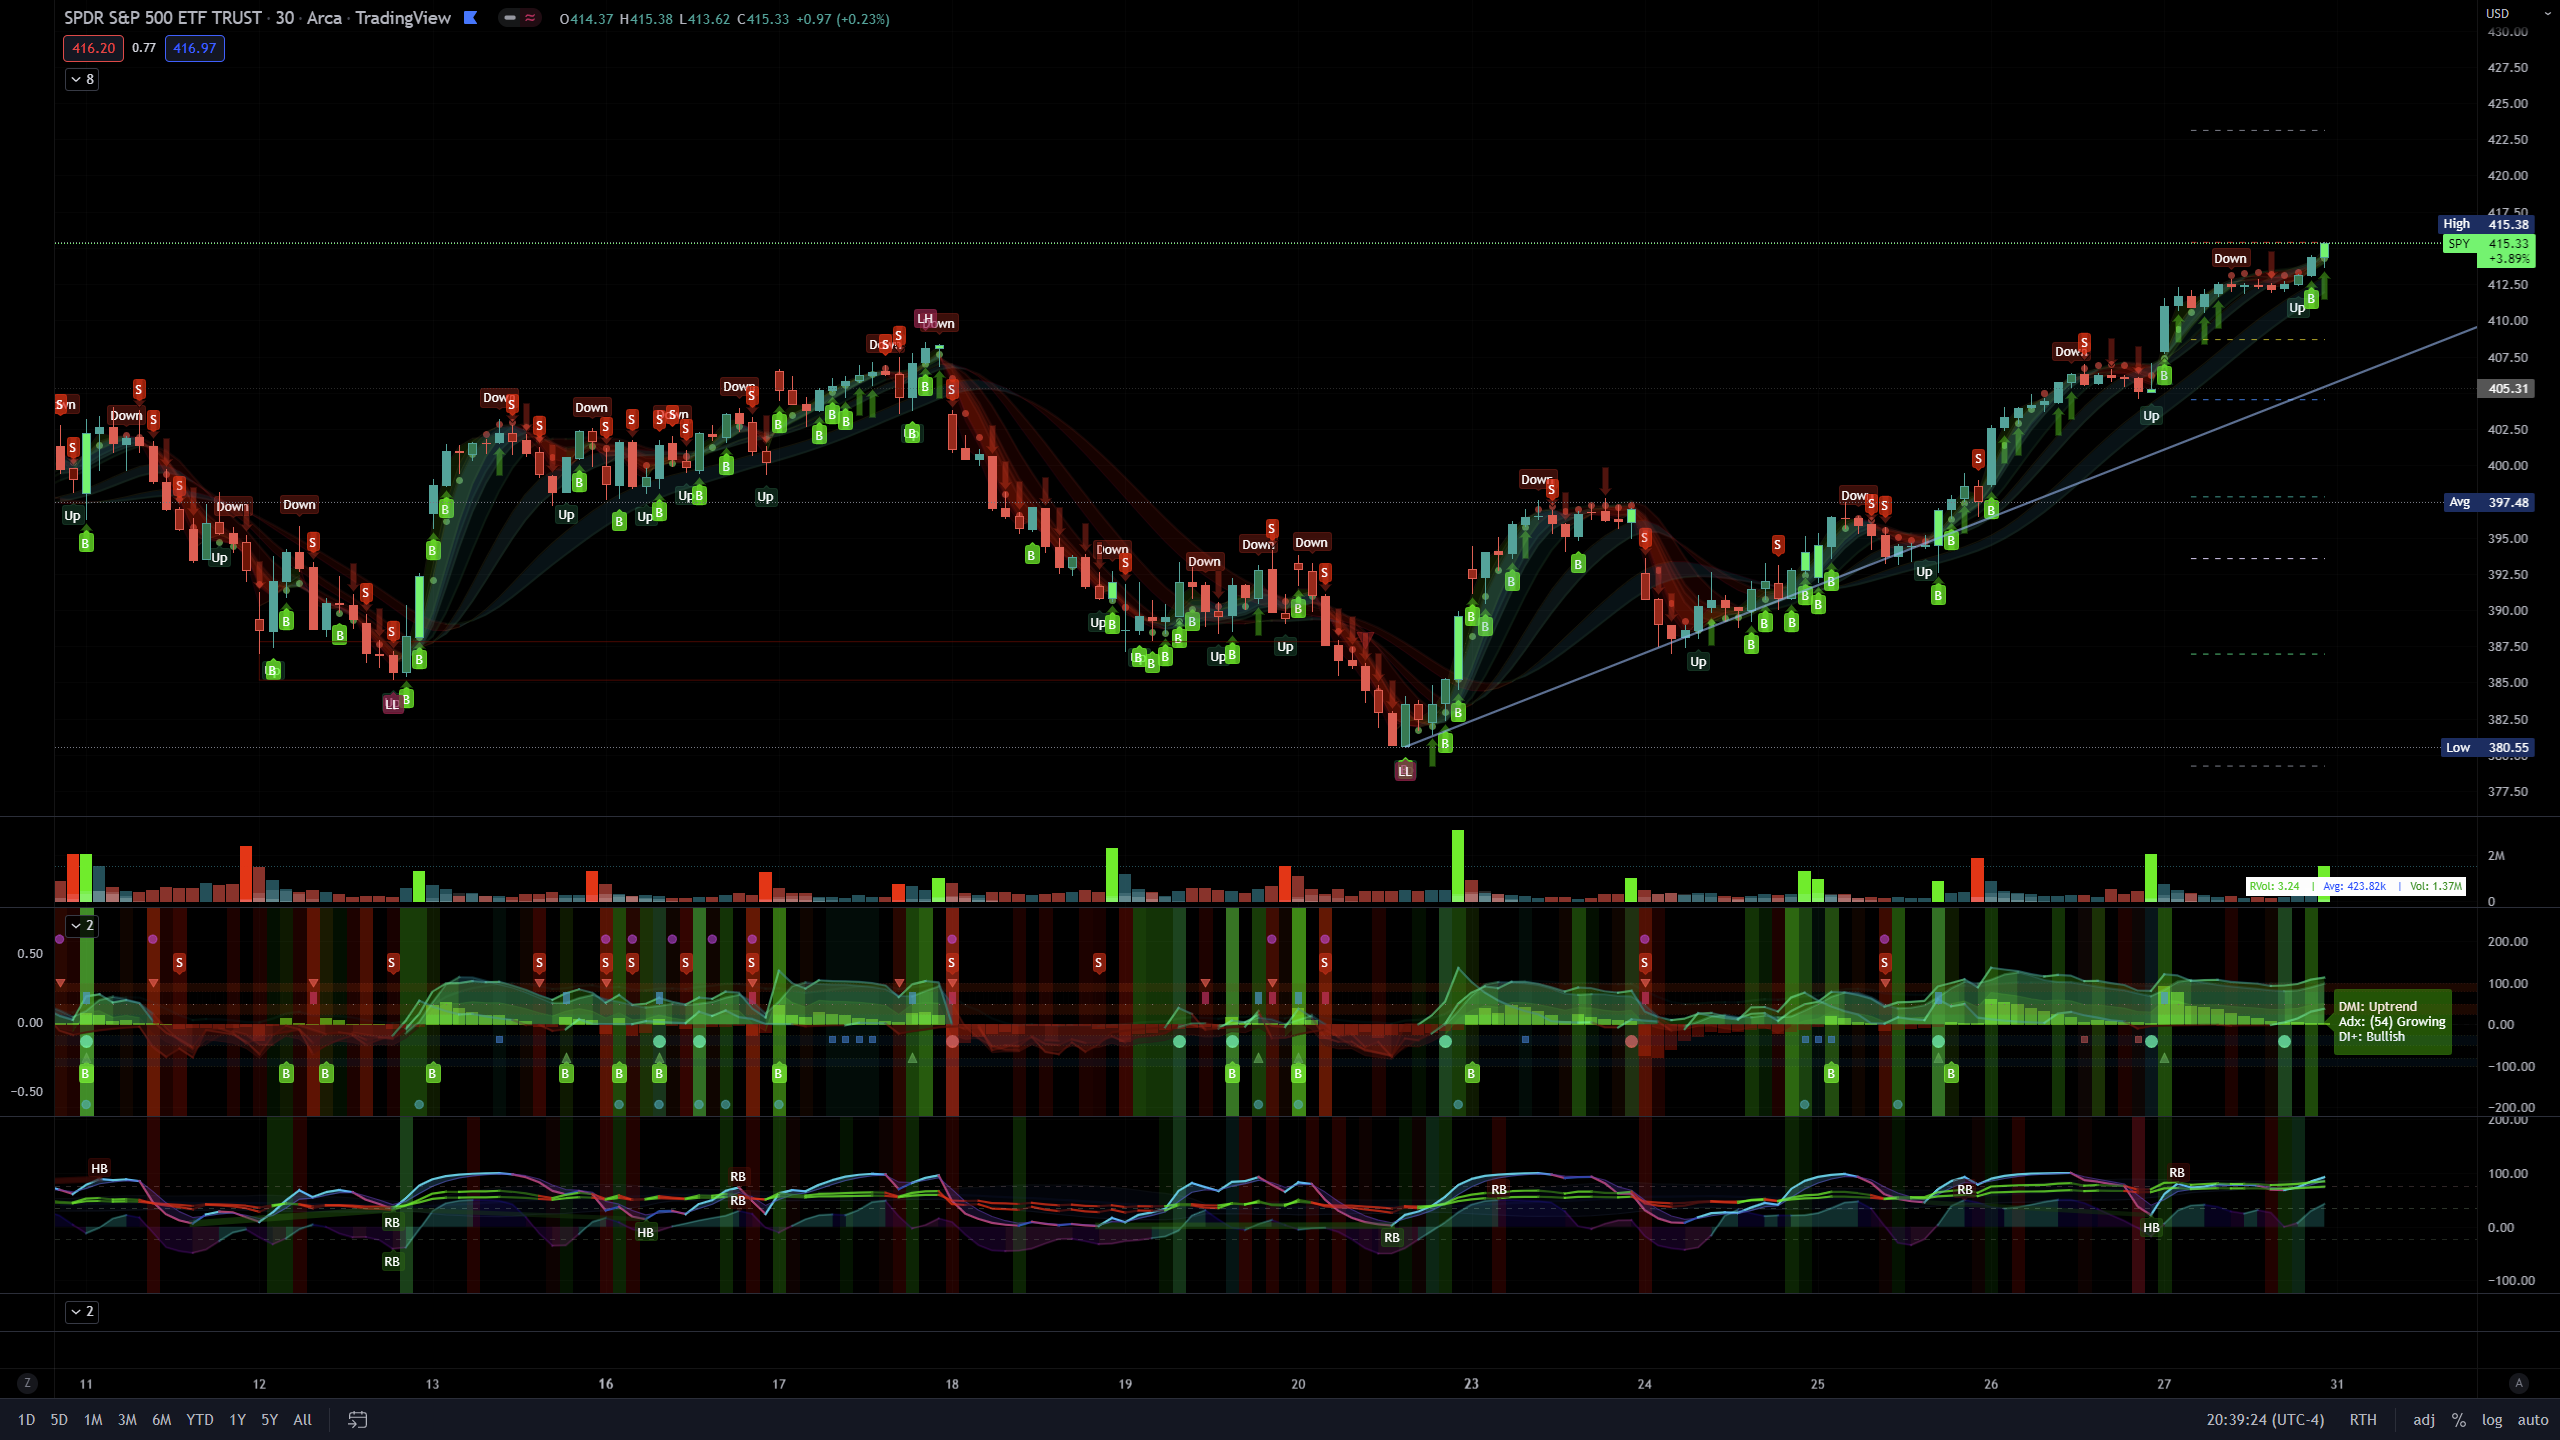
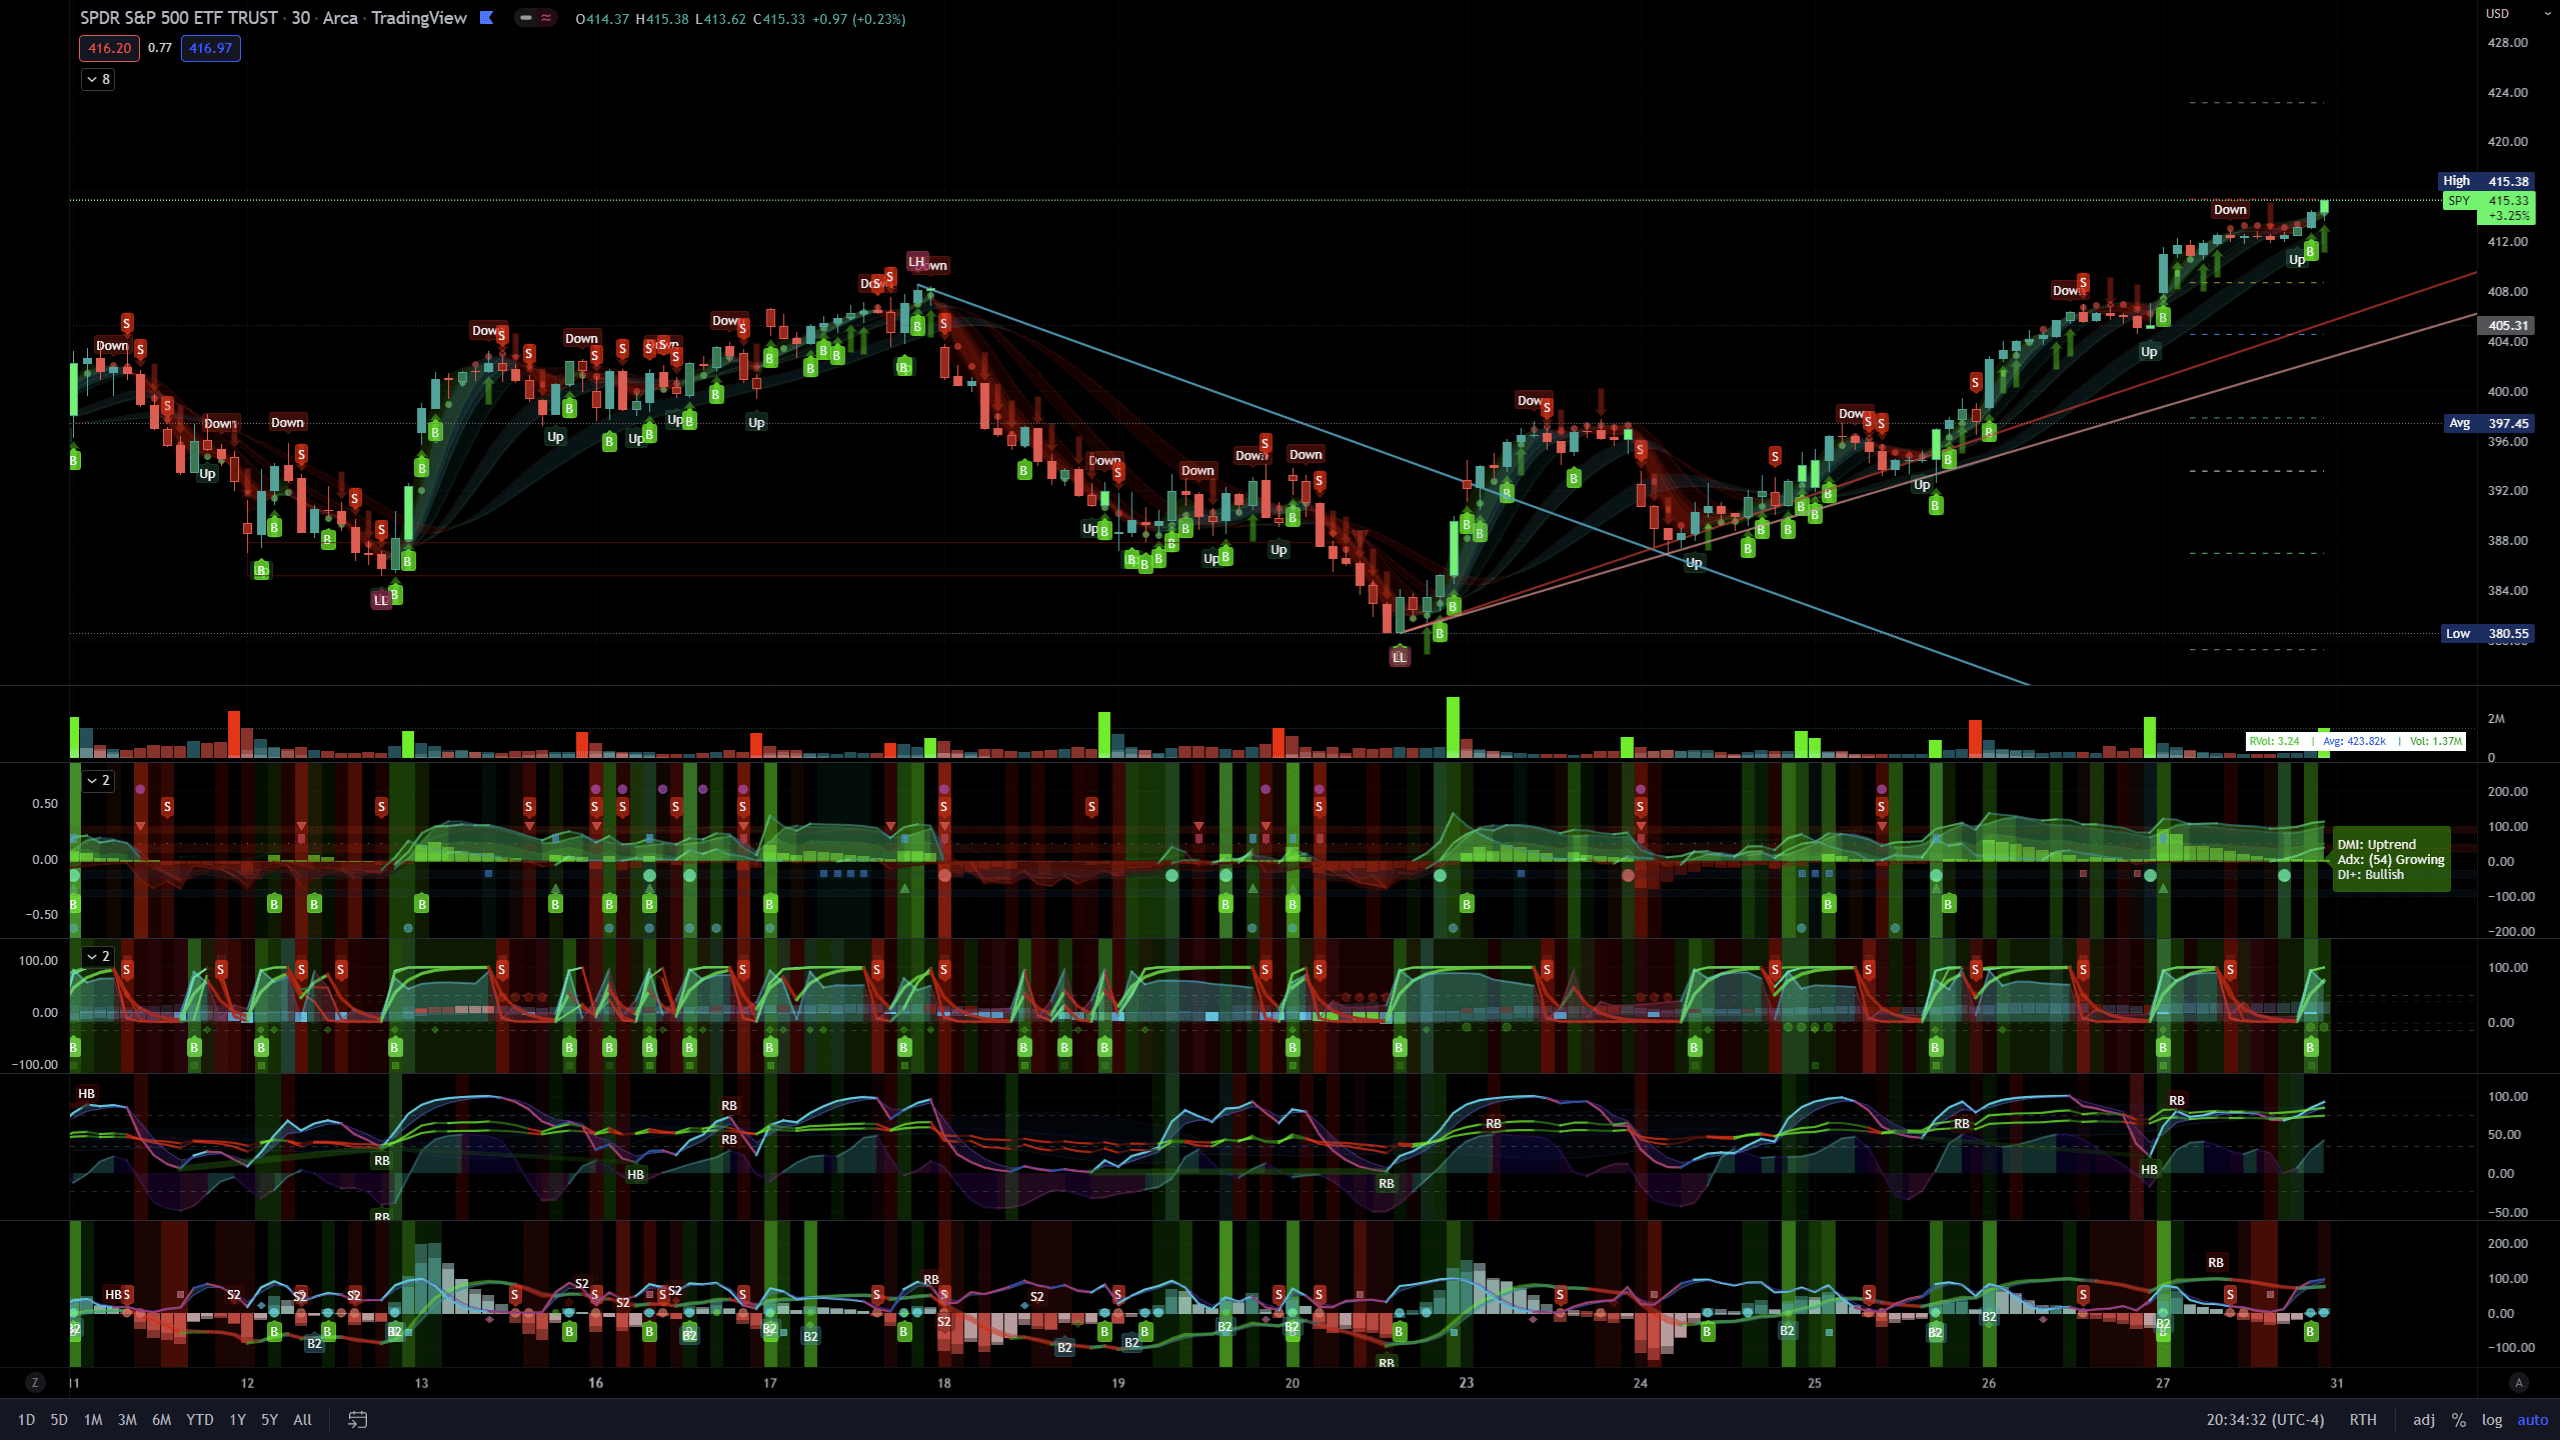
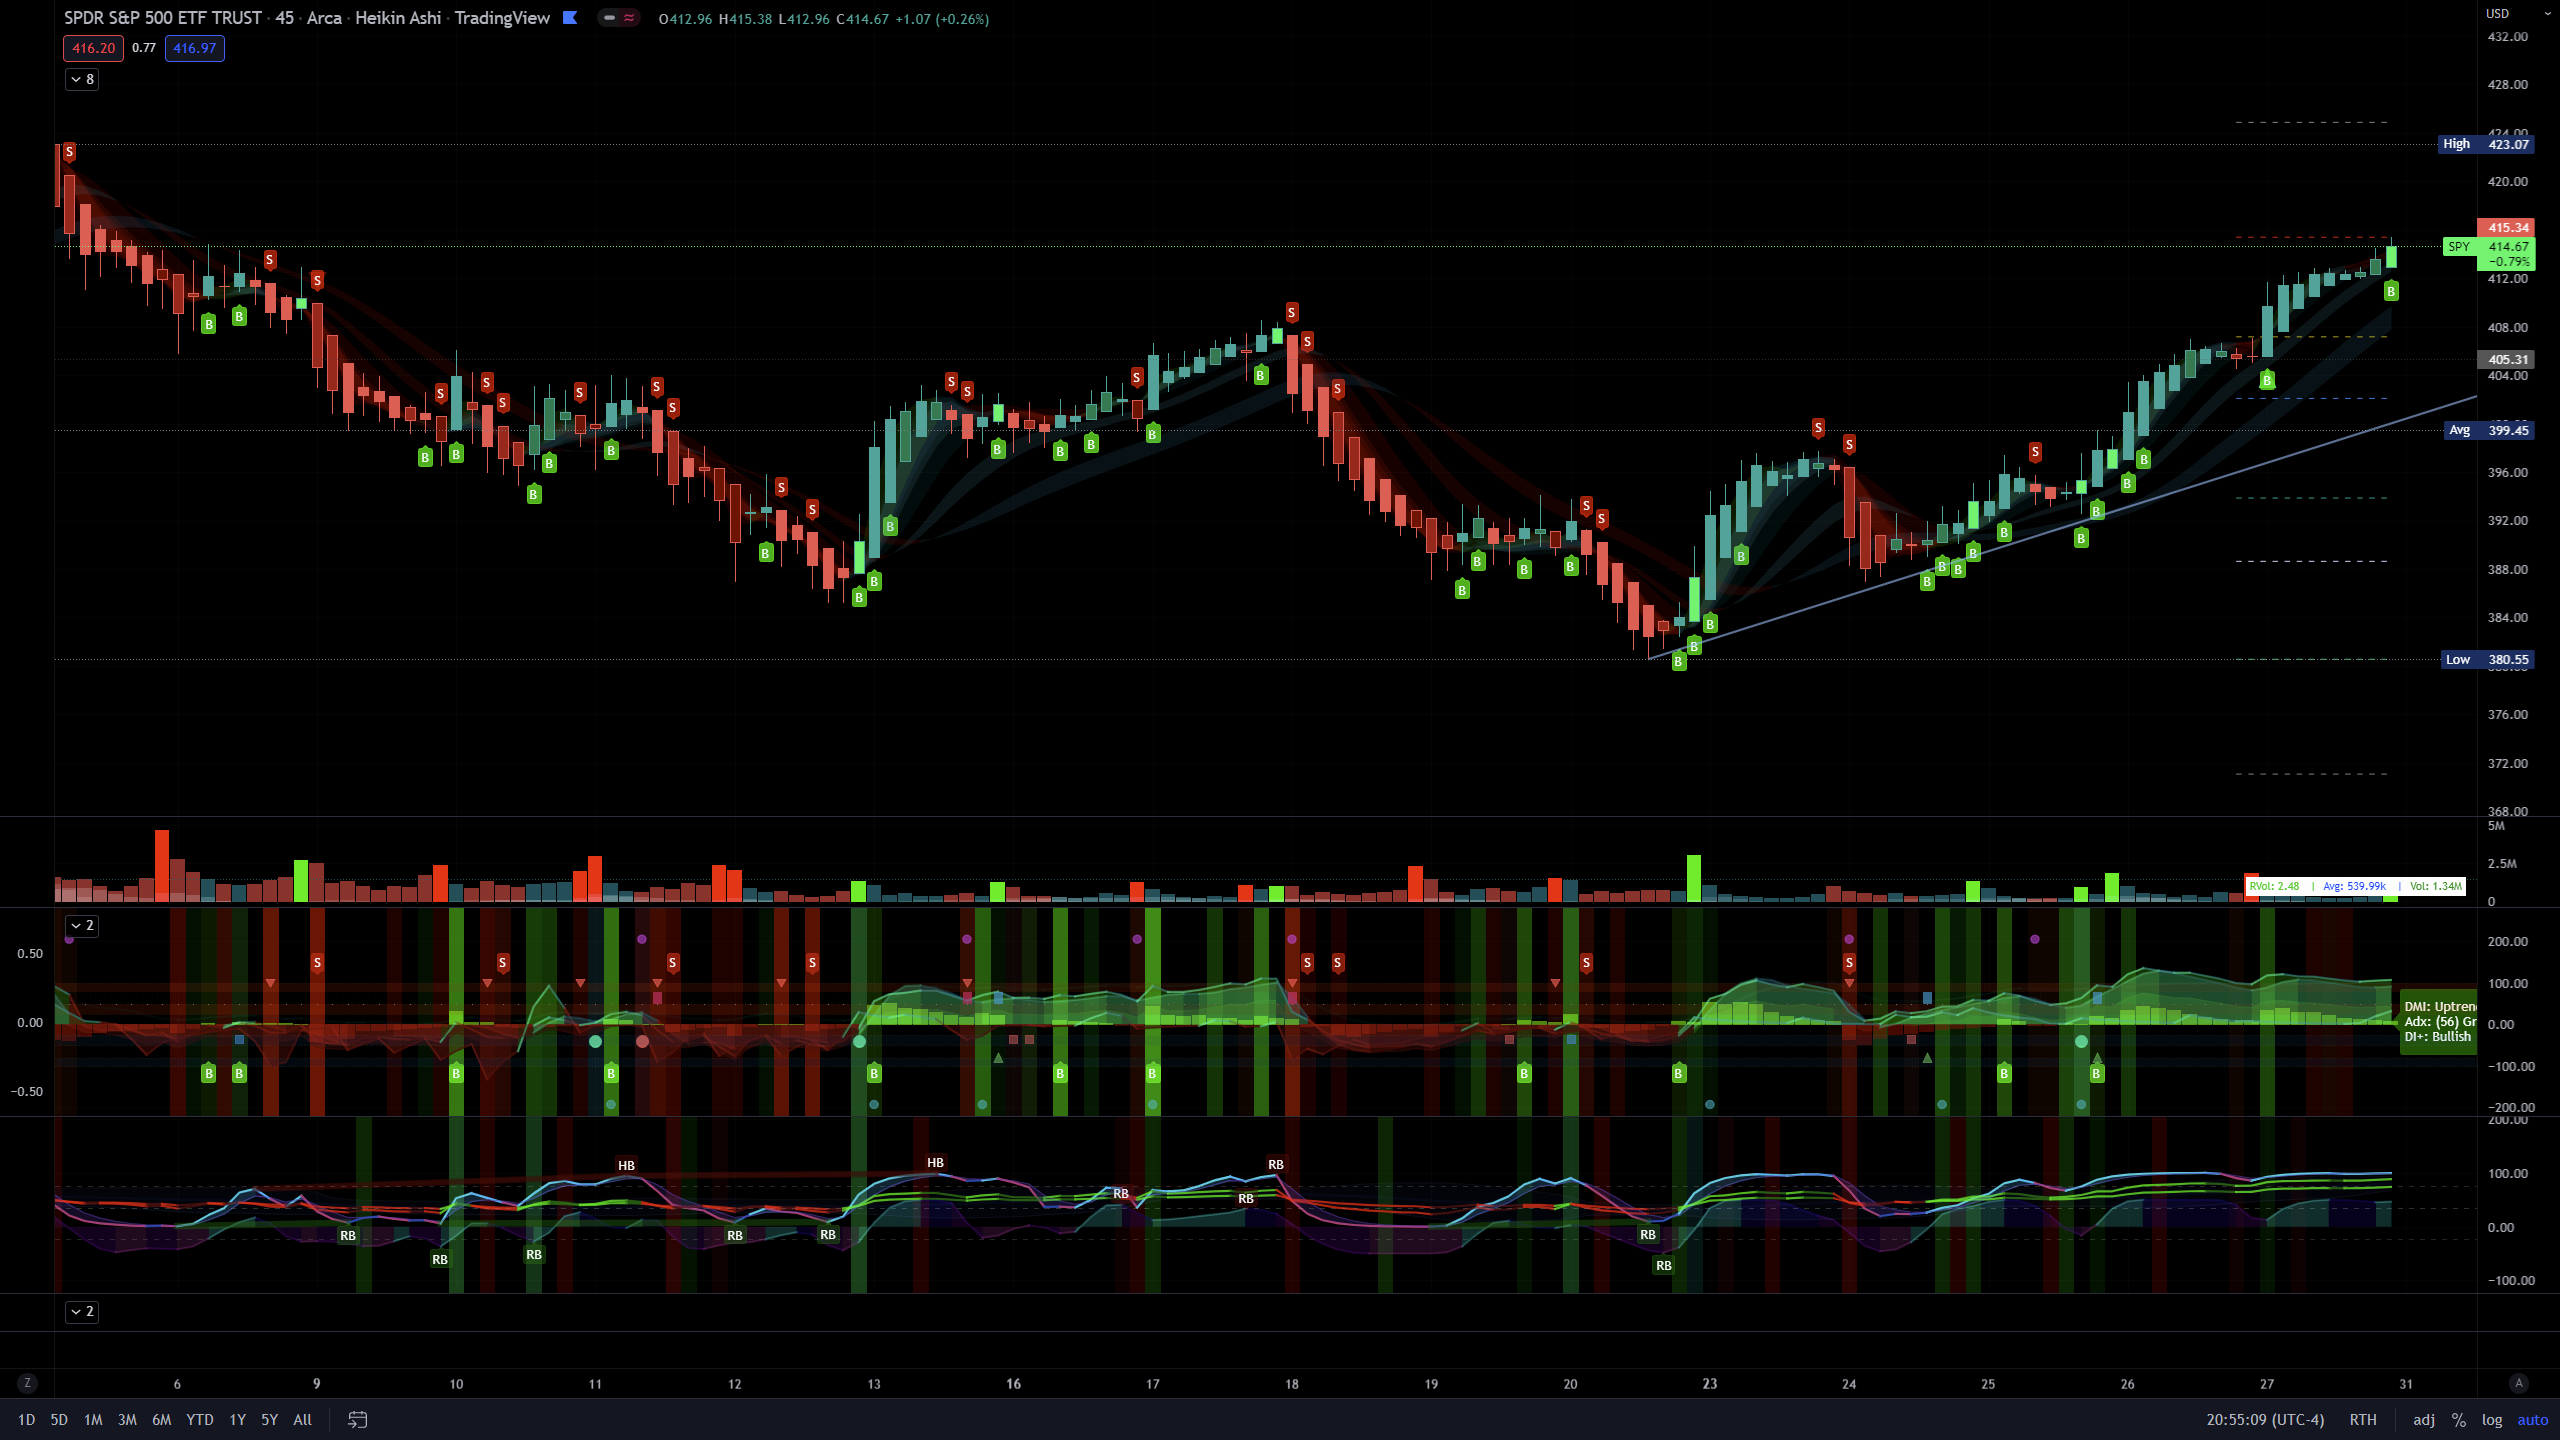
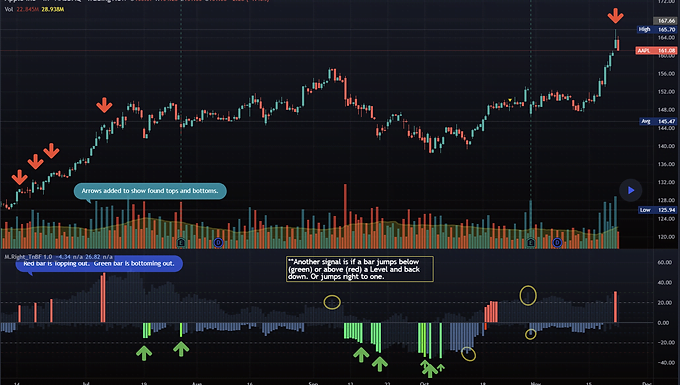
What to look for:
- When it detects the trend bottoming it will send a green histogram bar down, I also created a different shade green for even more likely bottoms.
- When it detects the top of the trend it will send a red bar up, I have a brighter red for more certain tops.
- The length of the histogram bar is also an indication as well. Sometimes there will be a reversal while still just showing the gray bar.