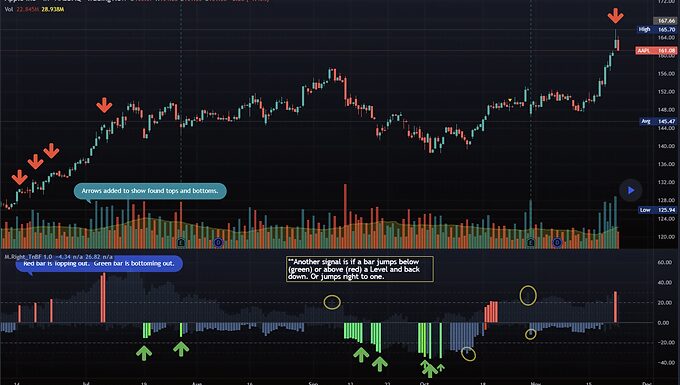
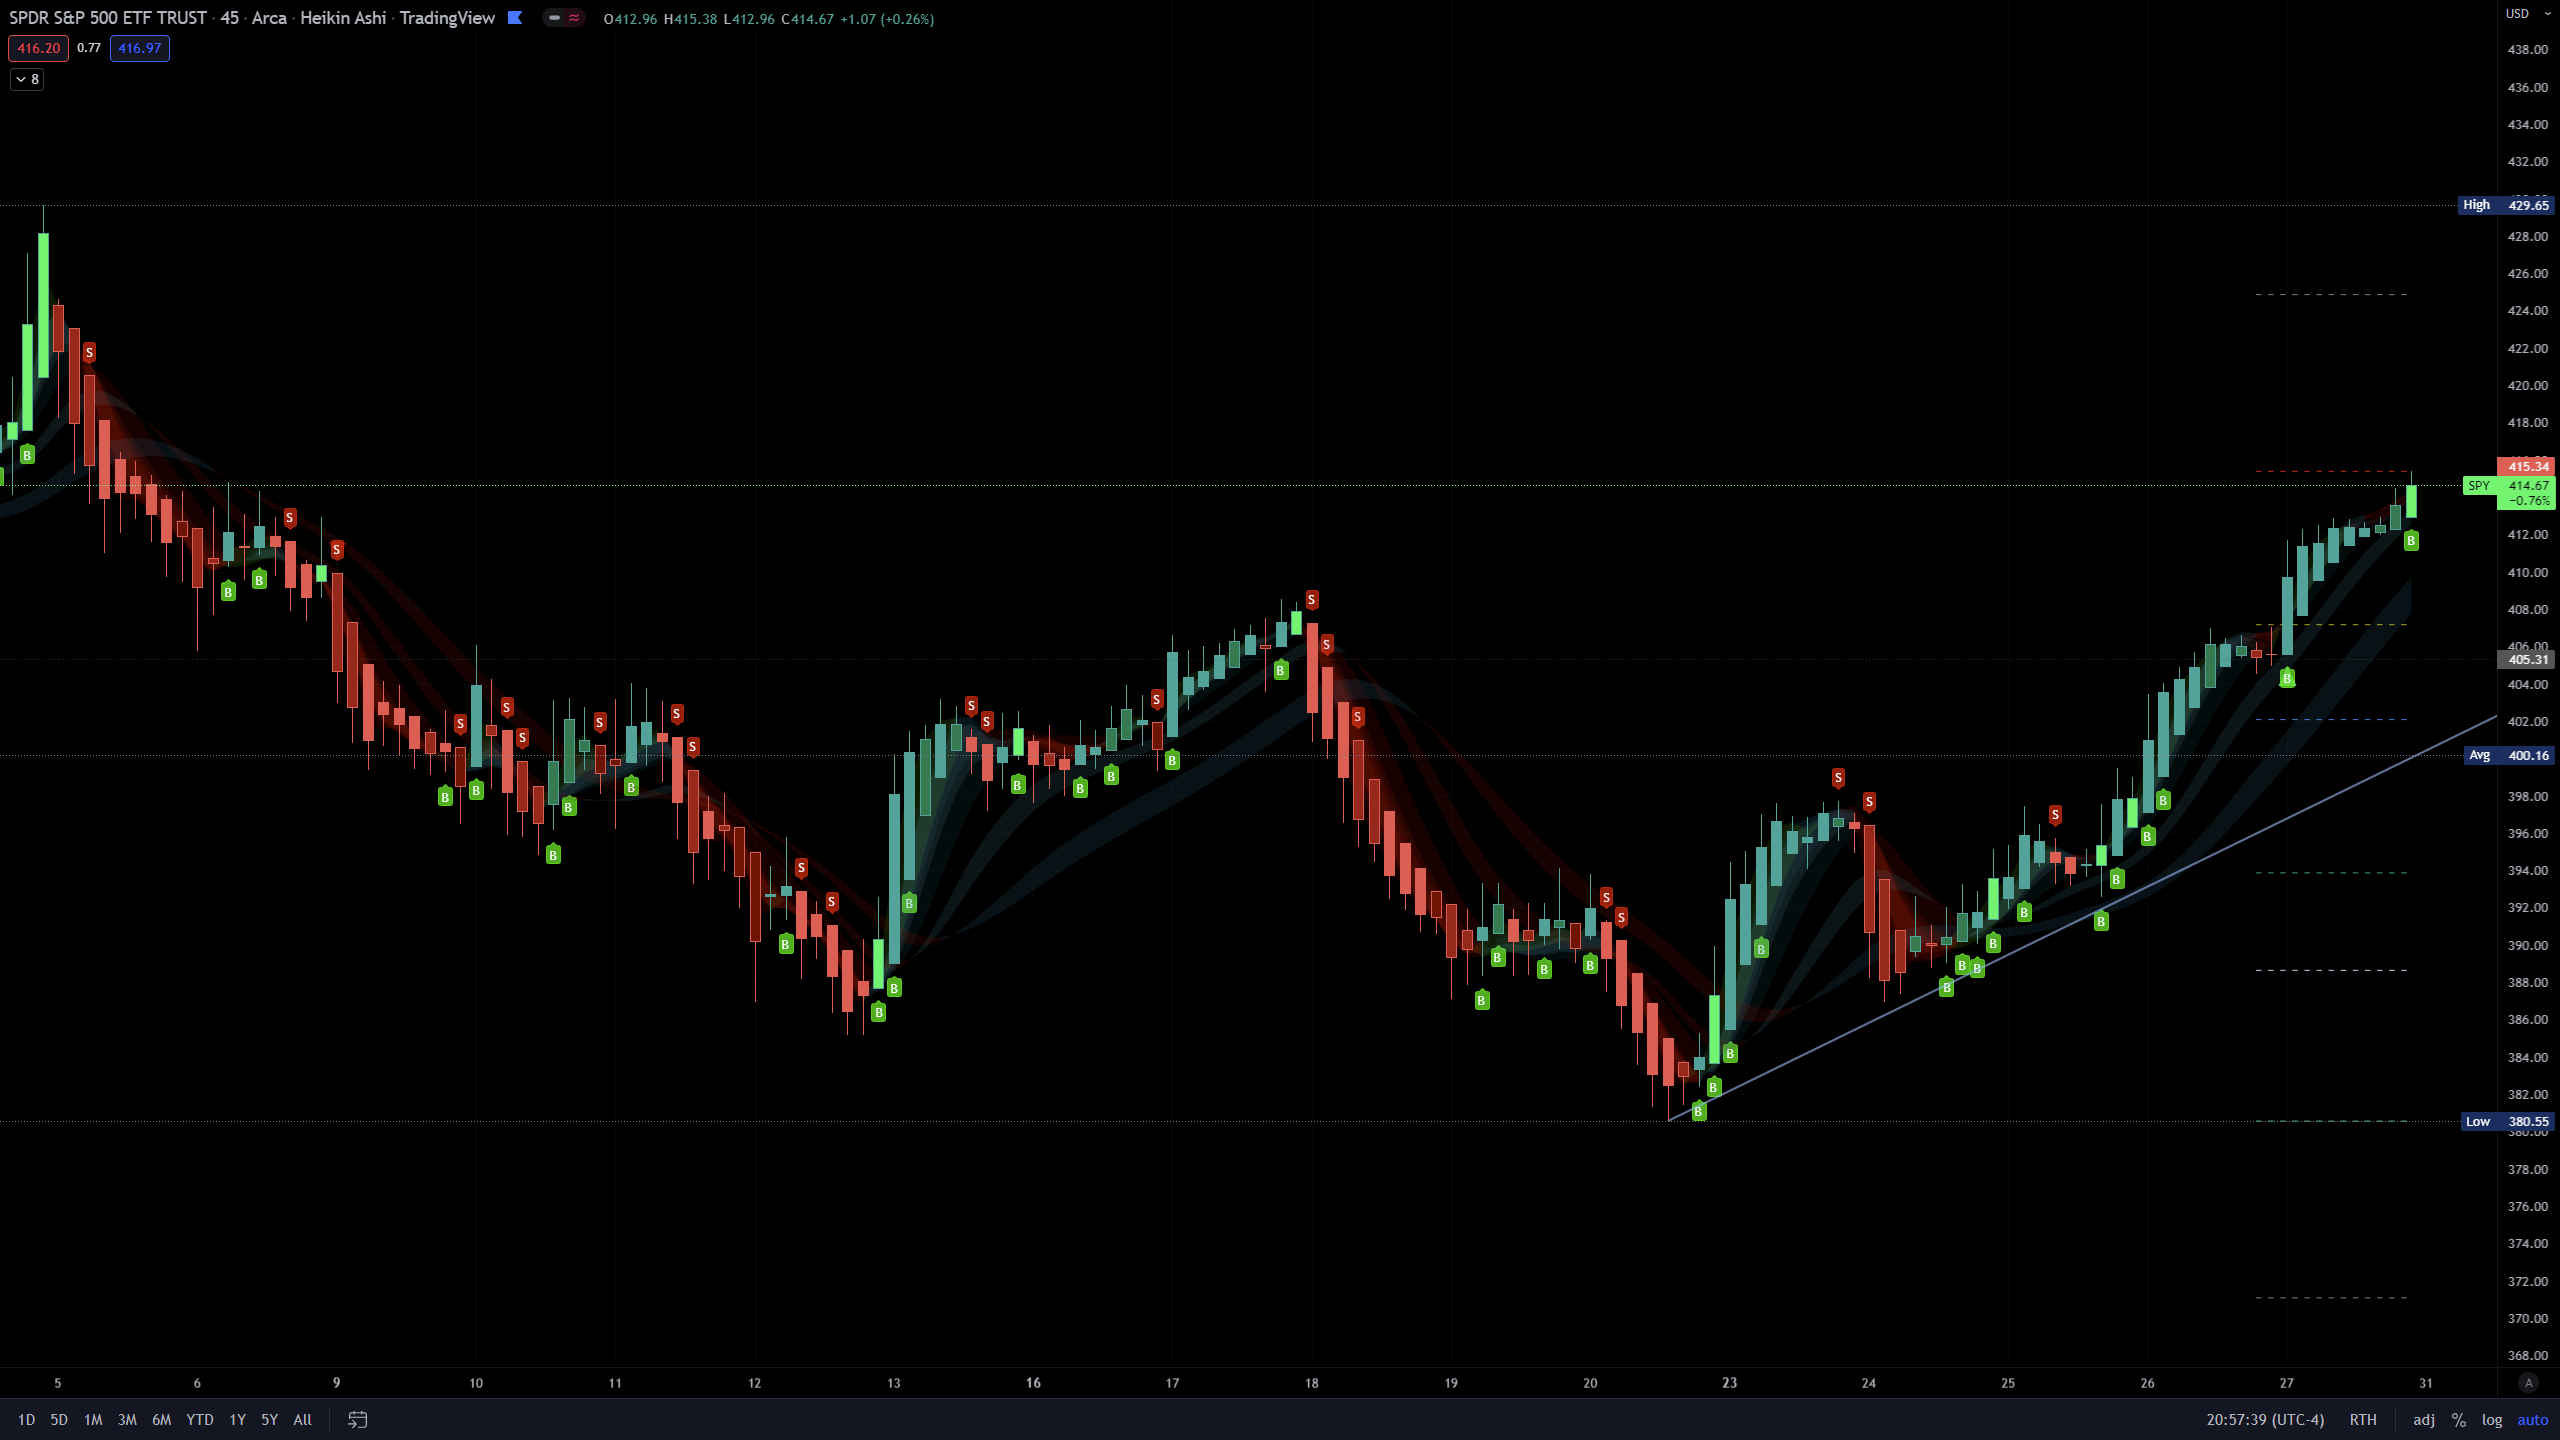
Uses volatility and standard deviations among other calculations to show you the top and bottom of trends.
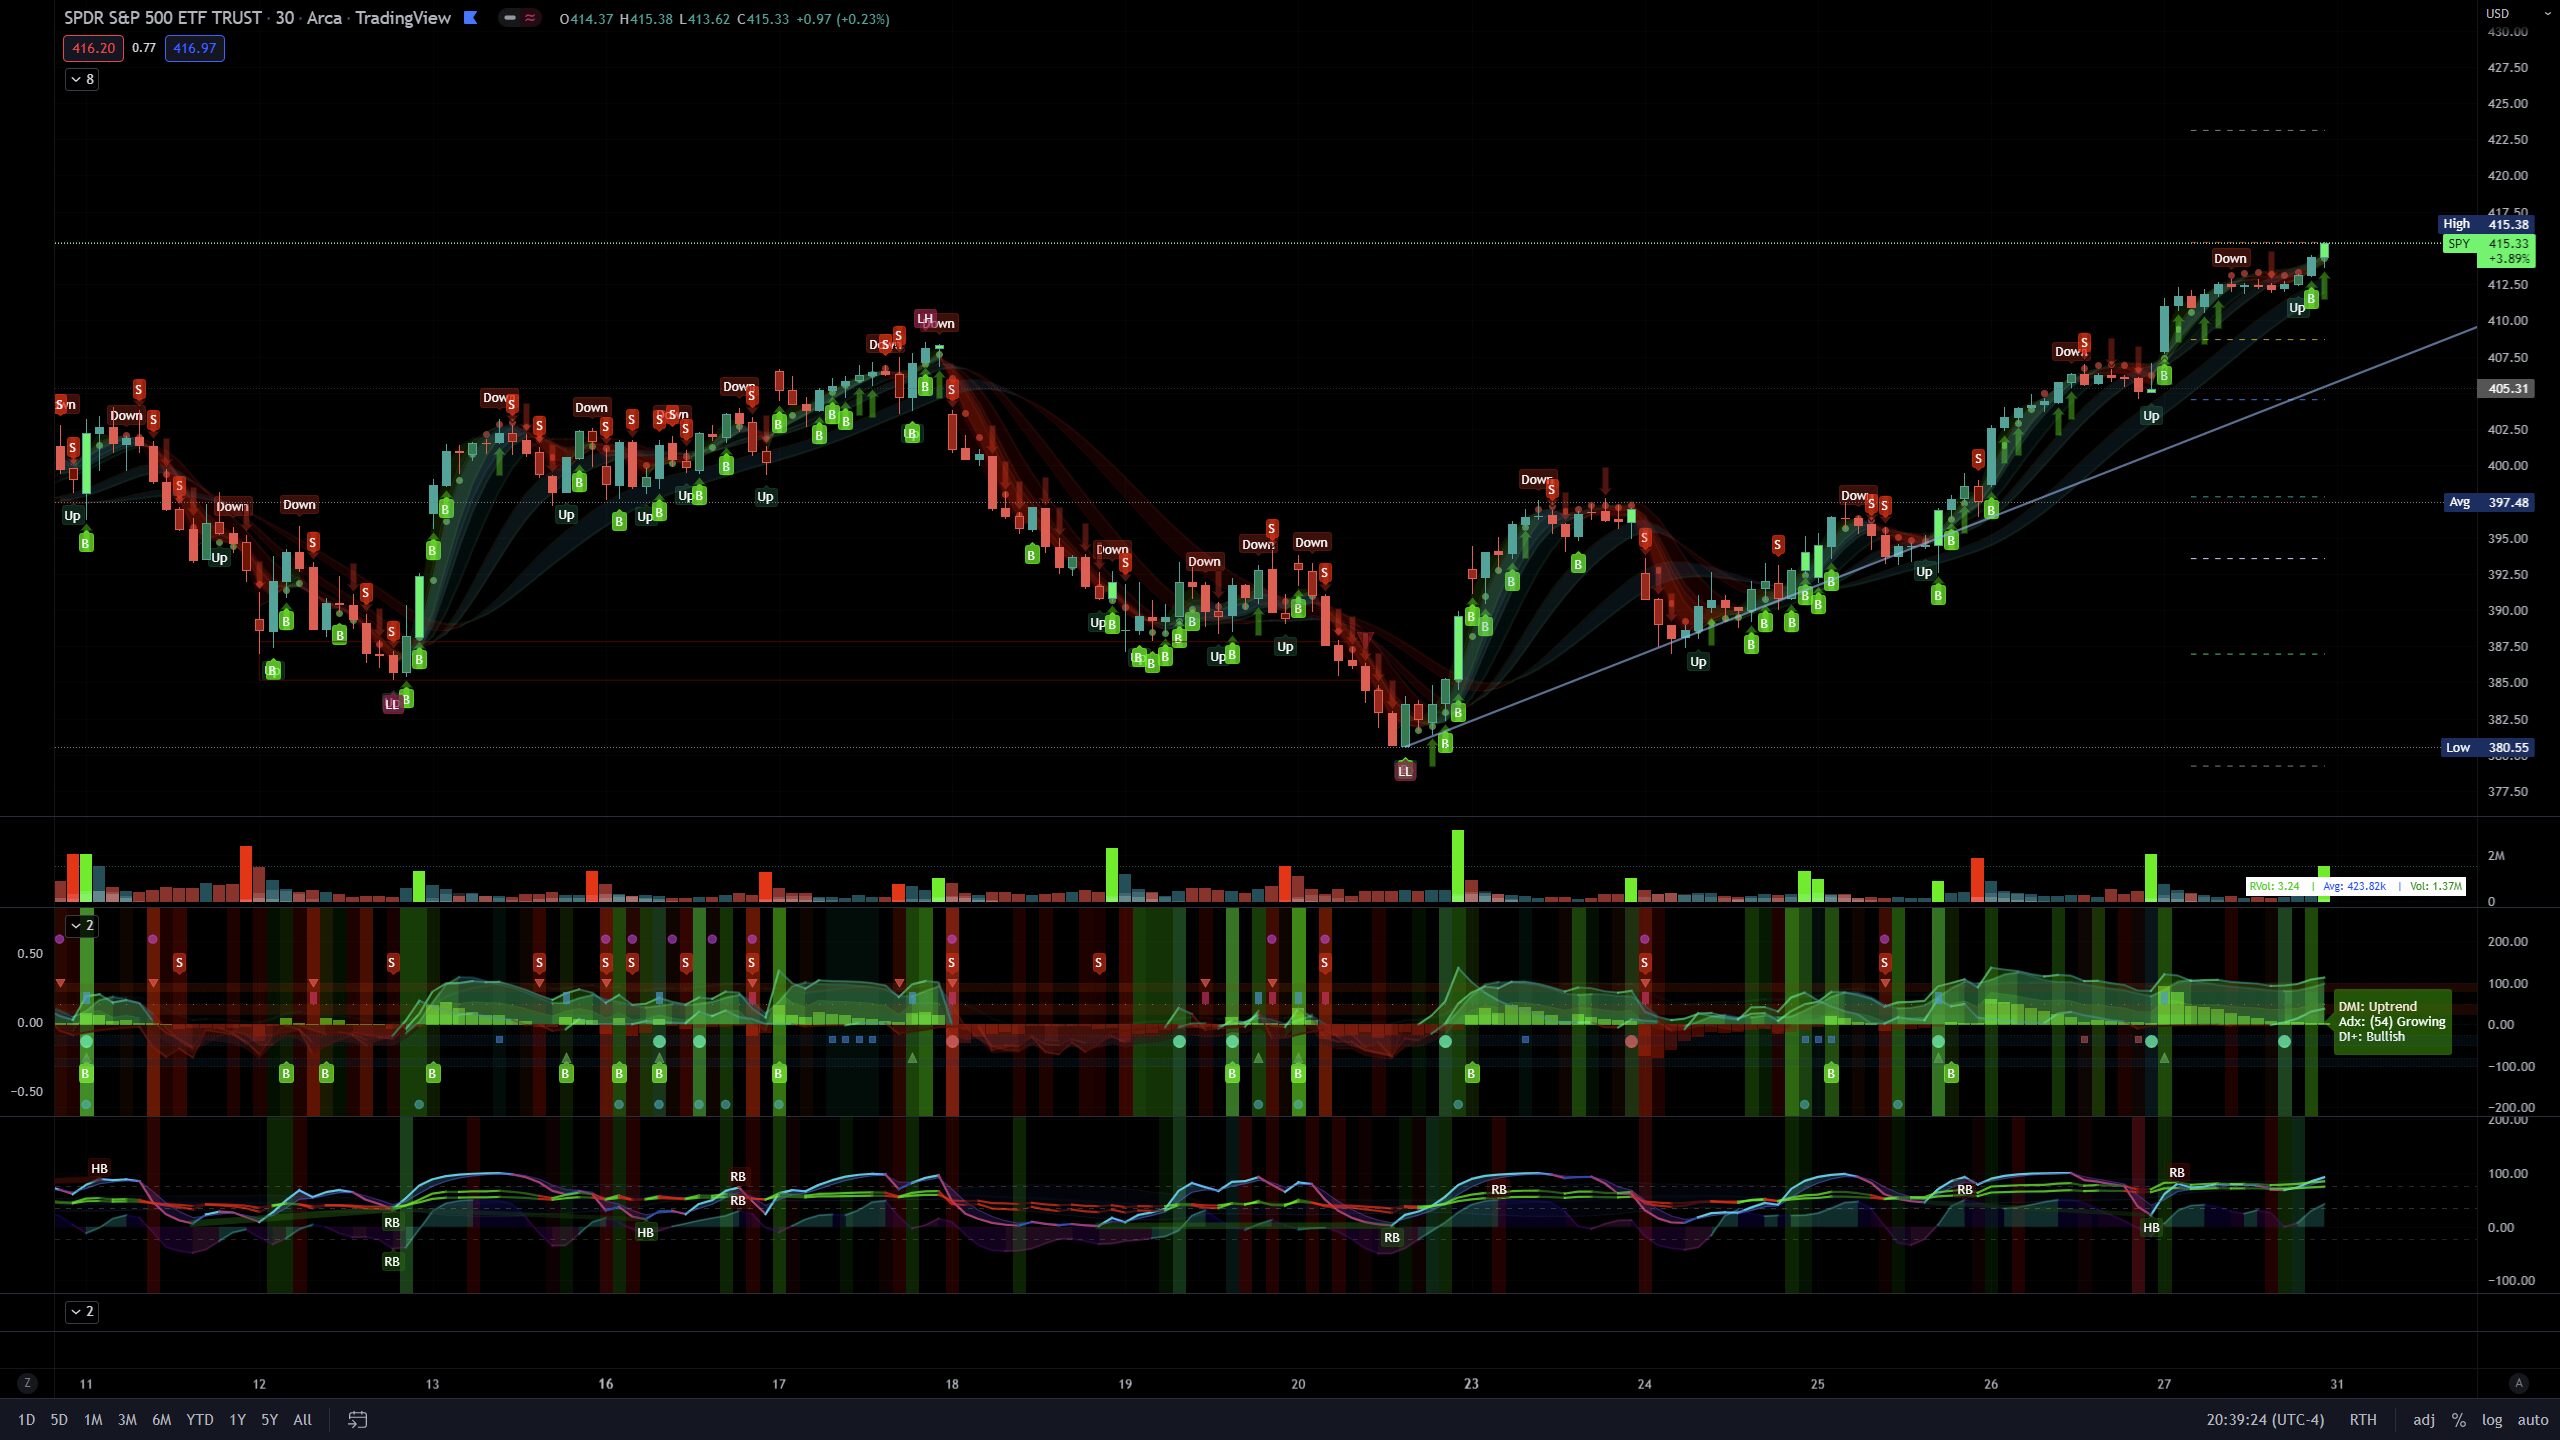
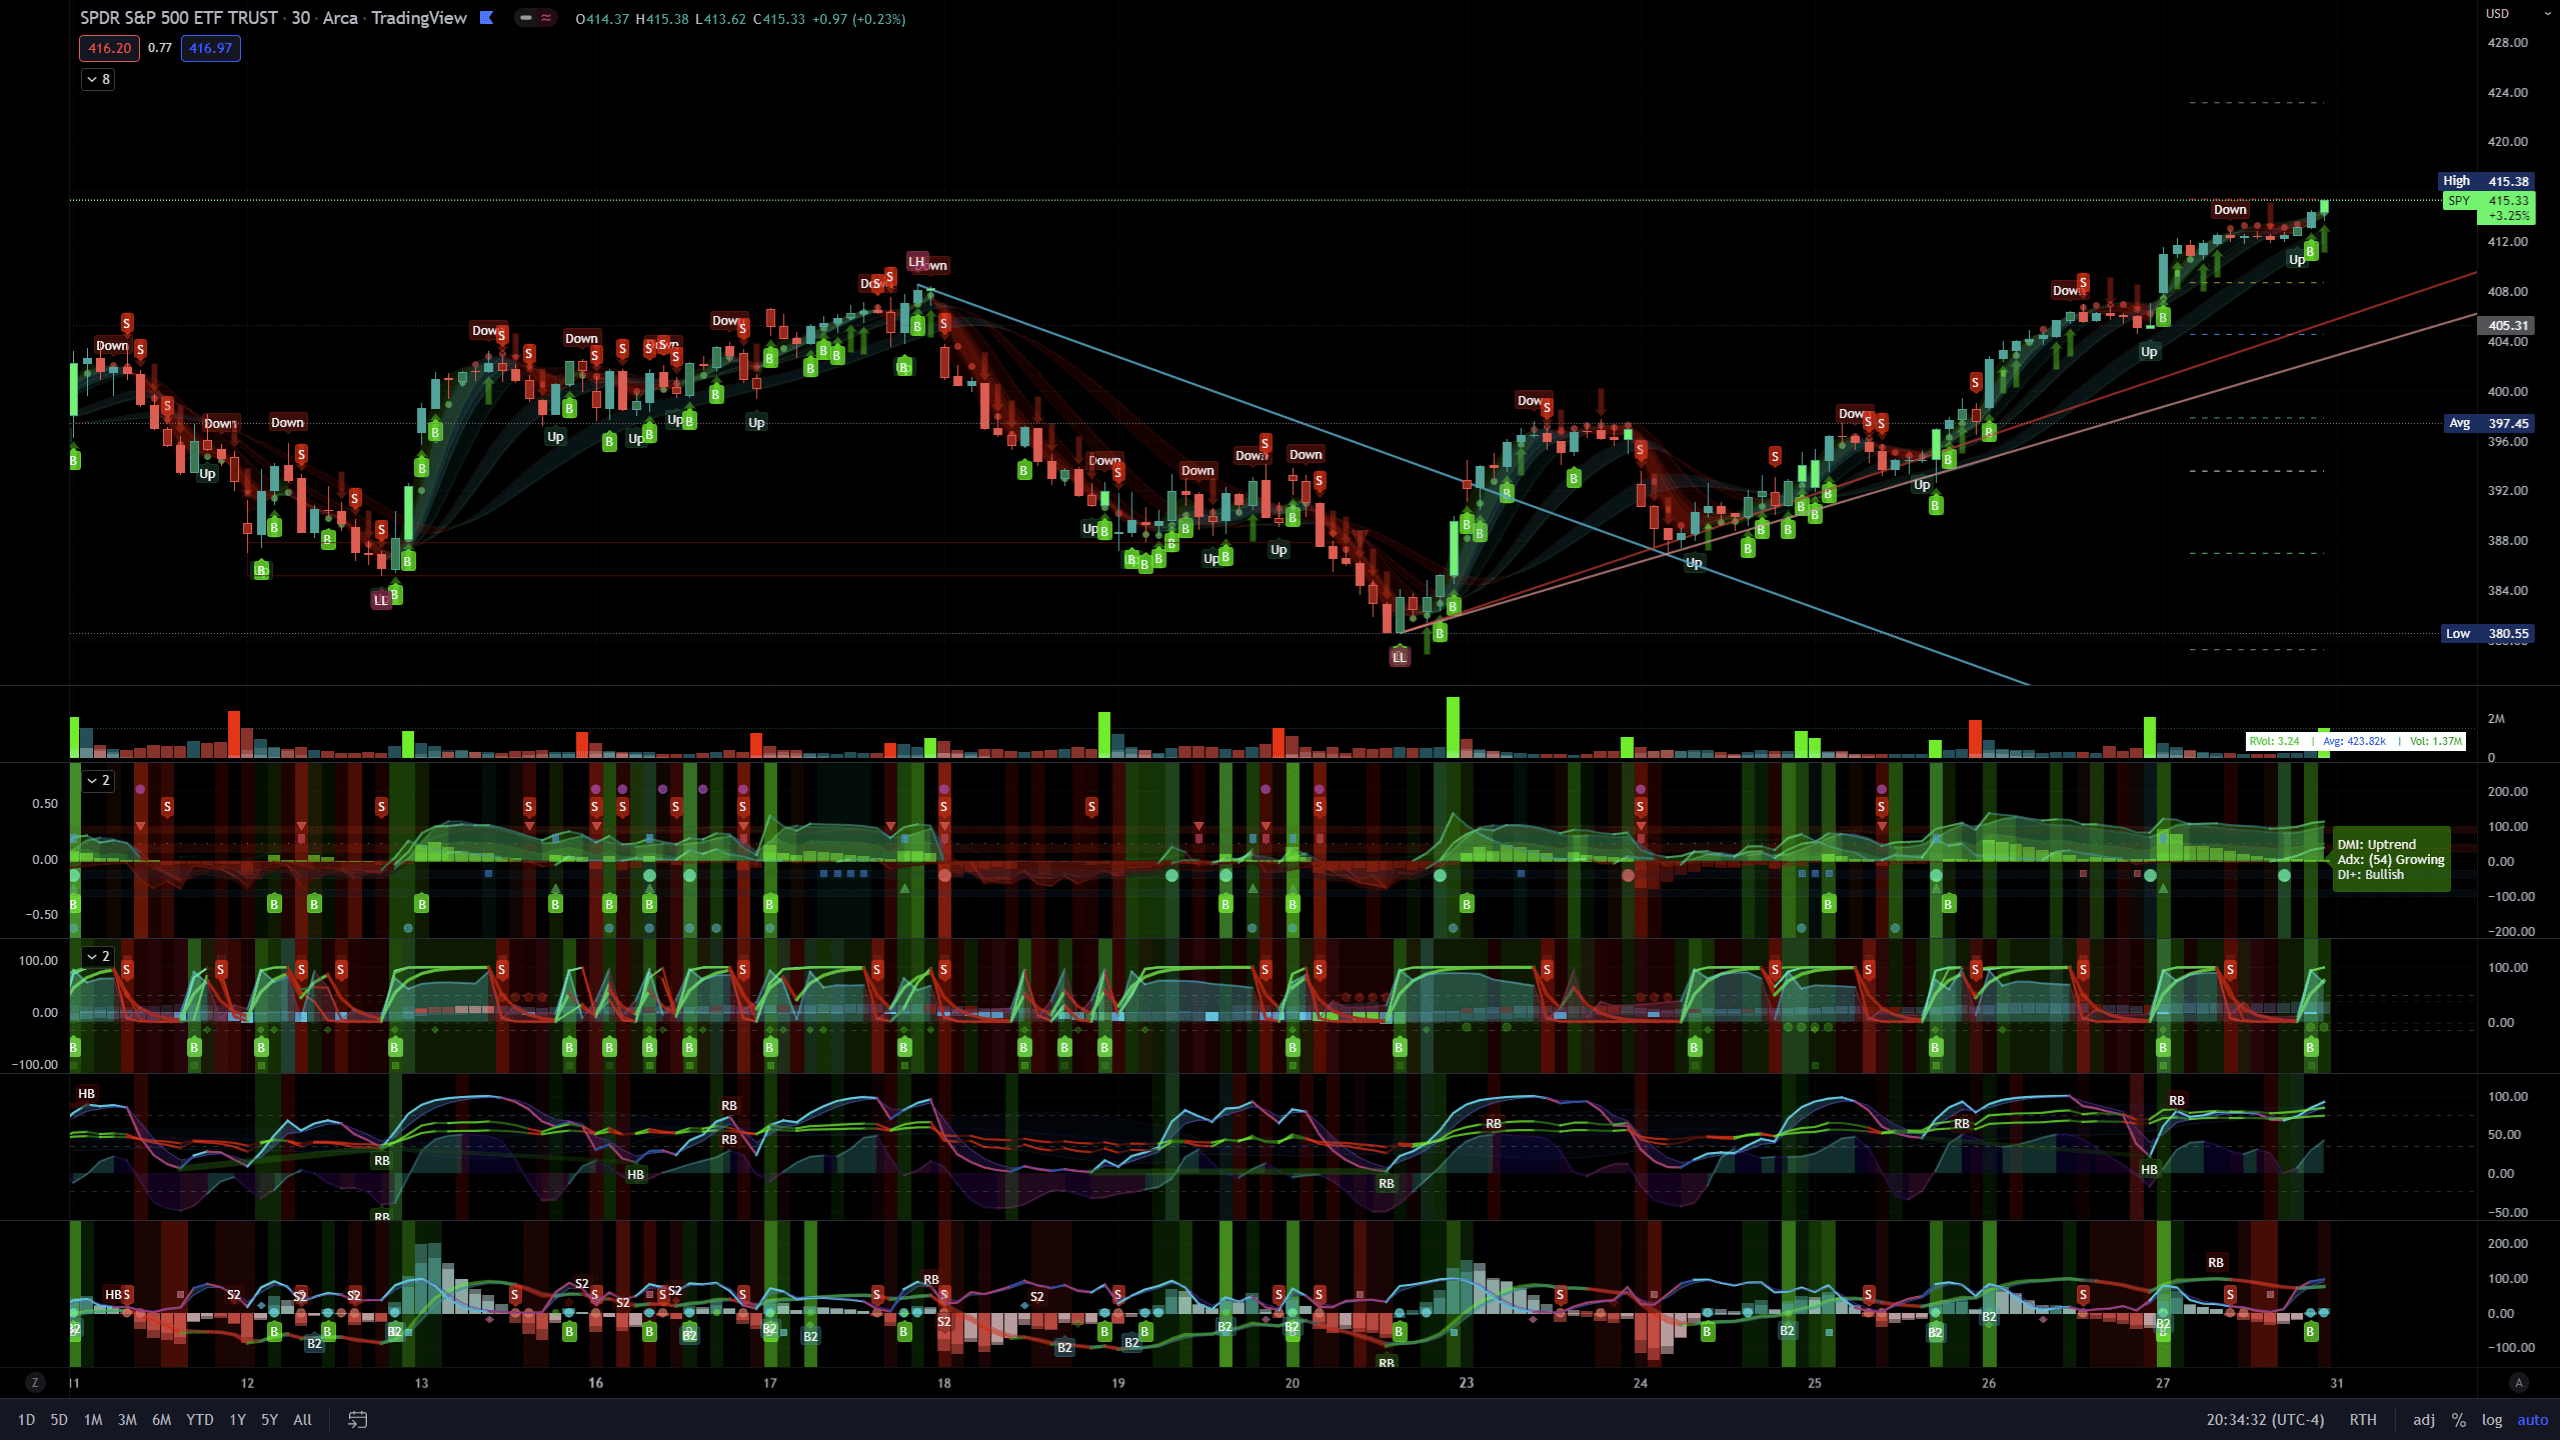
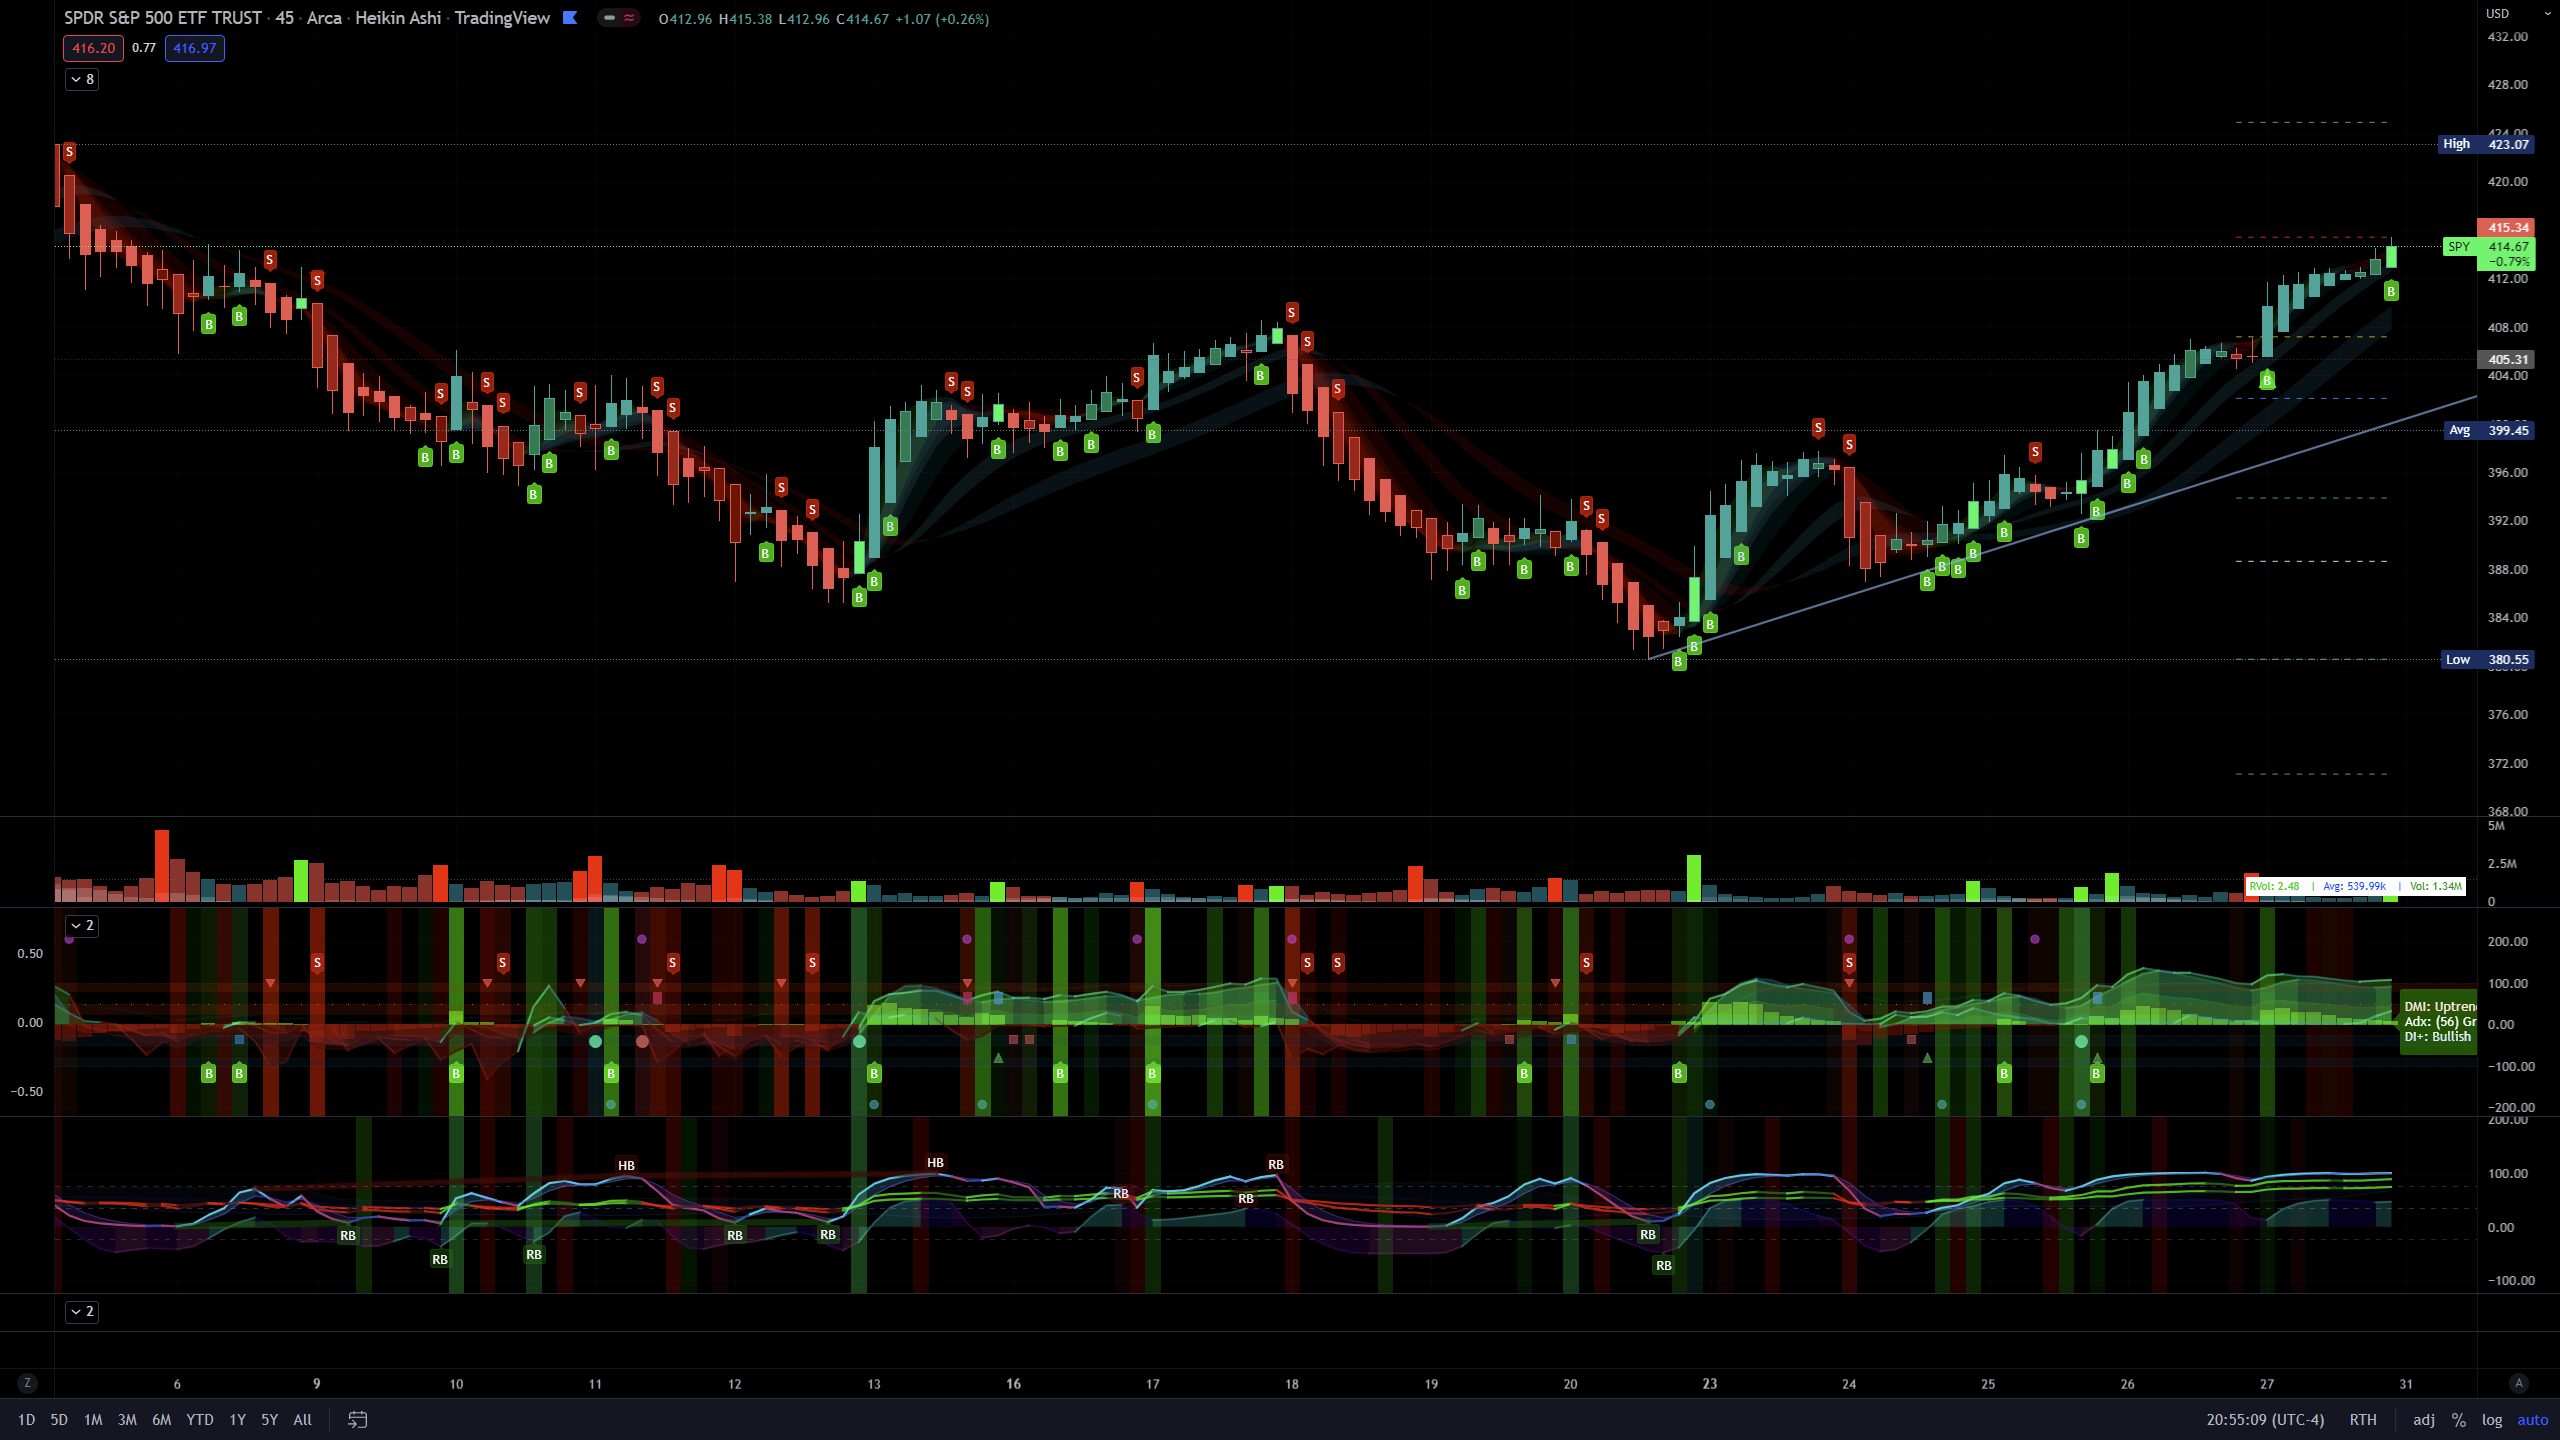
It works on low timeframes, I typically use it on 5m, 30m, 4hr, and 1d.