![Bulls V. Bears [tug-of-war] (Free)](https://uprighttrades.com/wp-content/uploads/2022/06/Image-empty-state.jpg)
Bulls V. Bears [tug-of-war] (Free) SquidGame Themed.
Visually represents the Bulls and Bears fight for control of Price.
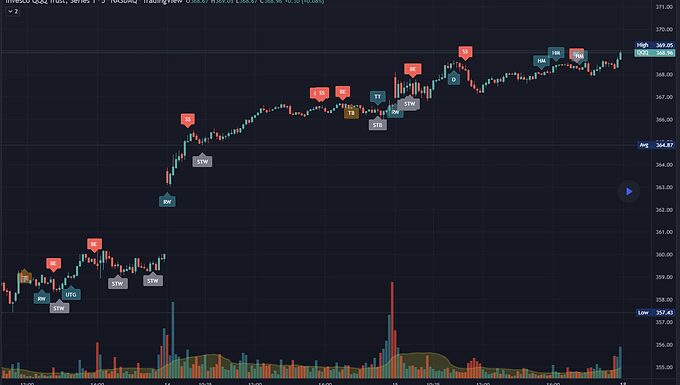
Candlestick Patterns & B Percentages Candlestick Patterns & Bulkowski Percentages
Candlestick Patterns with Bulkowski Percentages on hover.
As a fan of Bulkowski, I figured I’d release this for everyone’s benefit as well.
The legendary candlestick pattern expert, Thomas Bulkowski, has over 35 years of trading and analysis experience and is the absolute go-to expert when it comes to candlestick pattern identification.
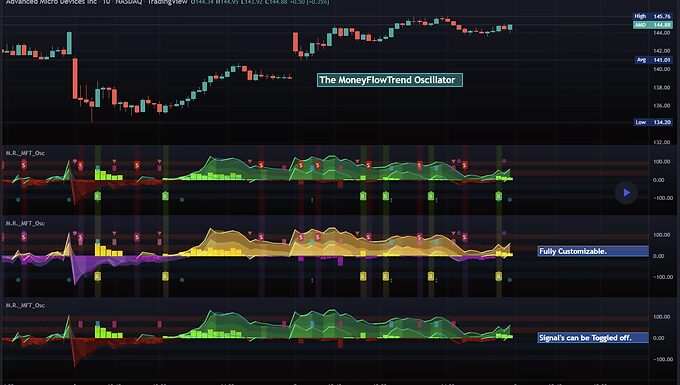
MoneyFlowTrend Oscillator (Free Version)
Original Supply and Demand Zone Separates Retail and Institutional Buyers.
Built on the idea of Supply & Demand Zones, this utilizes money flow and numerous calculations to create a picture of what is happening underneath the surface of the price action.
Richard Wykoff was one of the first market analysts to explain how the economic cycle can be applied to explain market price action; thus, technical analysis. He described two zones among the total of 4 phases; the two zones are Distribution and Accumulation zones, also known as Supply & Demand zones.
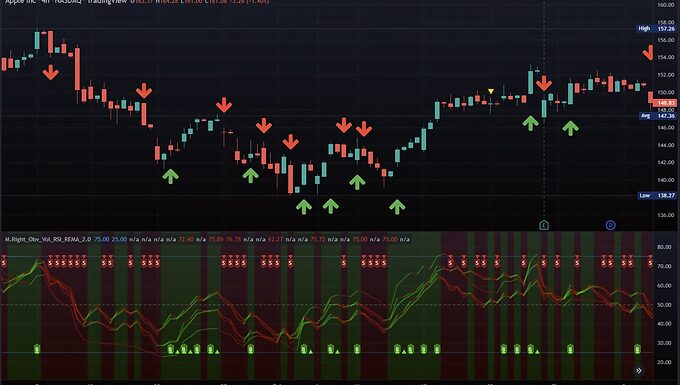
OBV / Volume Smoothed RSI & 3 RSI EMAs
Measures relative strength and volatility to provide entry and exit times.
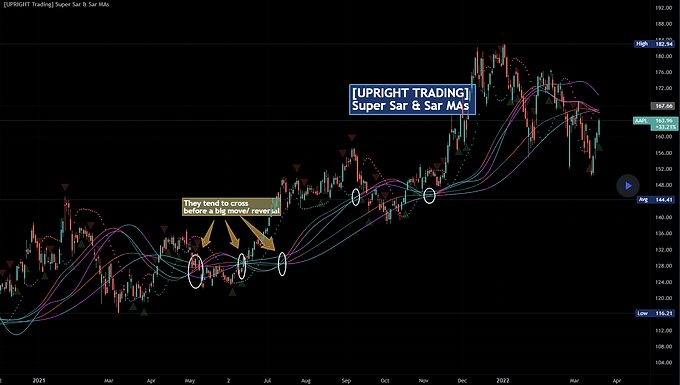
Top & Bottom Finder (Free)
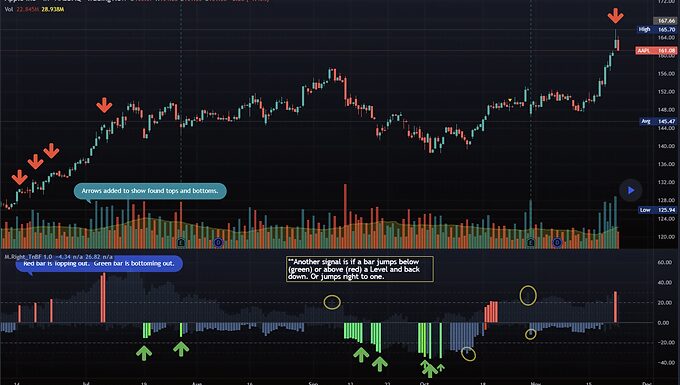
Finds Tops and Bottoms of Trends.
When it detects the trend bottoming it will send a green histogram bar down, I also created a different shade green for even more likely bottoms.
When it detects the top of the trend it will send a red bar up, I have a brighter red for more certain tops.
The length of the histogram bar is also an indication as well. Sometimes there will be a reversal while still just showing the gray bar.
Trend Direction Force Index
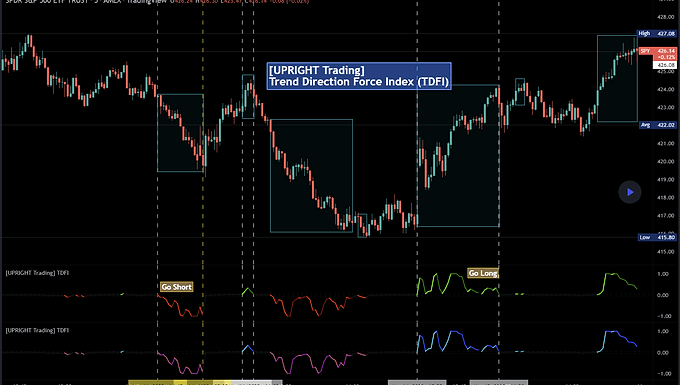
TDFI filters out trends so you enter at the right time.
The Trend Direction Force Index, TDFI or TDF Index, is a staple in the Forex community, but is excellent on most asset (i.e. stock) trading.
Developed by Pyotr Wojdyo for metastock trading platform originally, but now on several other.
The idea of the TDFI is that there is enough trend directional force to enter the trade.
Aroon Exit Oscillator
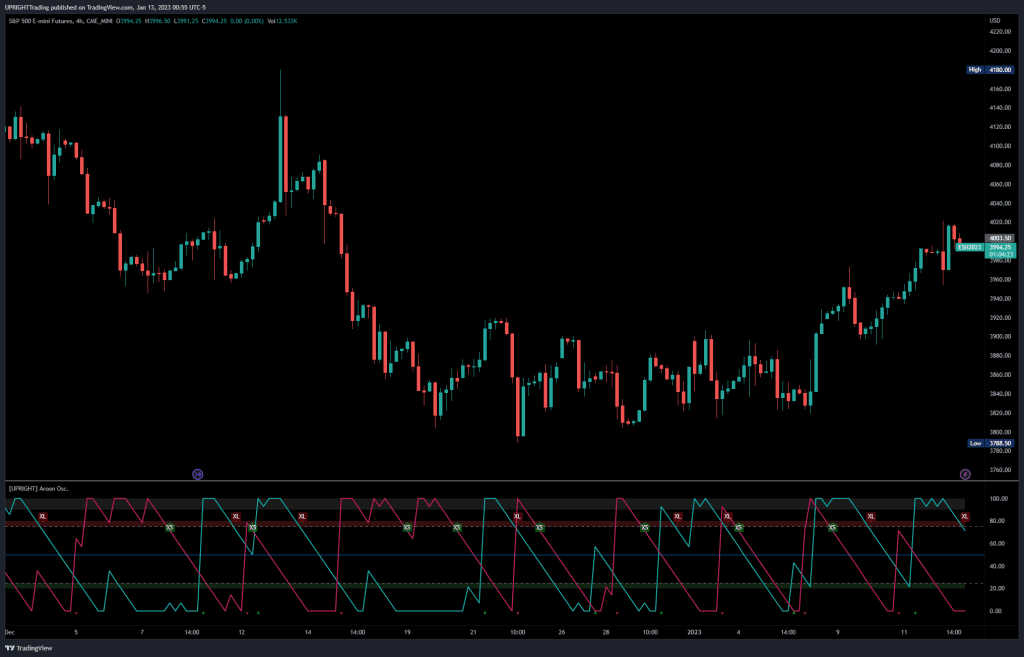
The Aroon Oscillator isn’t the most accurate for entries, but we find its strength in its exits.
The Aroon Oscillator was developed by legendary technical analyst, T. Chande, in 1995 as part of his “Aroon Indicator system.” Chande’s intention was for his system to determine trend changes. The name “Aroon” comes from the Sanskrit language and roughly translates to “Dawn’s early light.”
Typically, Aroon uses 25 periods; looking for the high and low 25 periods back, to show its “Aroon Up” and “Aroon Down” lines. The Aroon lines go from 0 to 100, with 100 showing a strong trend and 0 showing a weak trend.
The Aroon Oscillator is like the DMI (Directional Movement Index) created by W. Wilder, in that it, too, uses up and down directional lines; however, Aroon is looking at periods back, while DMI looks at Price difference.
I do not recommend using this indicator alone, it will give late or false signals. Only really meant as a complimentary indicator.